



Bitcoin, Gold Price Outlook: US CPI & Overbought Risks in Focus
Bitcoin, Gold Price Outlook Following a steep risk-on rally across US equity indices and precious metals, several major markets are approaching critical technical levels as momentum becomes increasingly stretched.
Share this:

Following a steep risk-on rally across US equity indices and precious metals, several major markets are approaching critical technical levels as momentum becomes increasingly stretched:
- Dow Jones: Extended its rally toward the 54,700 record high and the upper boundary of its rising channel dating back to 2022, while monthly momentum is flashing overbought conditions last seen in 2018. Dow Analysis
- Gold and silver: Broke above their year-long descending resistance structures and June-August consolidations, while daily momentum has entered overbought territory near critical resistance levels.
- US Dollar Index (DXY): Dropped toward the rising support near 99.30 that has defined its bullish 2026 trend.
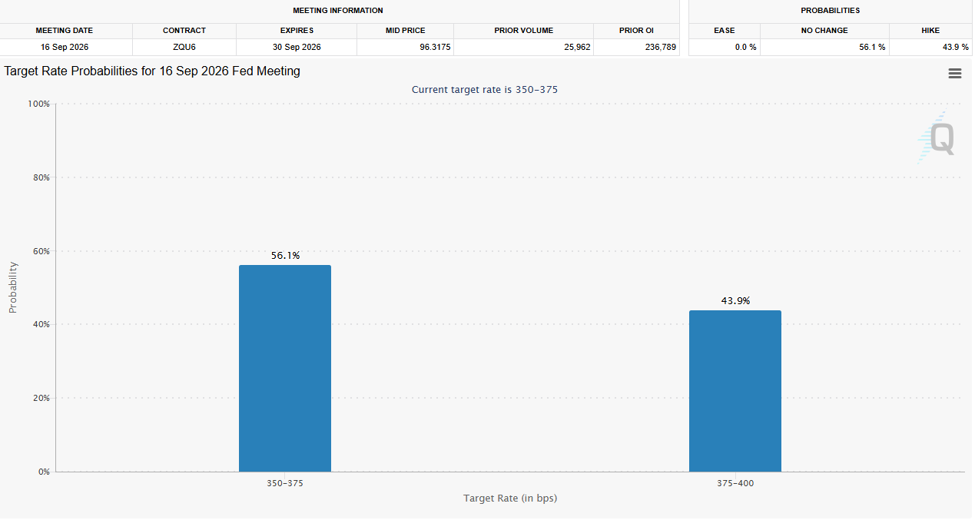
- Fed expectations: September rate-hike expectations fell back below 50% following a weaker-than-expected Non-Farm Payrolls report. However, markets remain cautious ahead of Wednesday's US CPI report and amid ongoing tensions surrounding the Strait of Hormuz.
- Bitcoin: Remains subdued despite broader market optimism, trading within its extended June-August 2026 consolidation and below the key $68,000 resistance level.
Whether Bitcoin is leading the next major risk-off move or simply lagging the broader market rally could become clearer as these key technical and macroeconomic catalysts unfold.
September Fed Rate-Hike Expectations Drop — For Now
Source: CME FedWatch Tool
Last week's weaker-than-expected US Non-Farm Payrolls report, at -23k, pushed expectations for a September Fed rate hike back below 50%, providing additional support for risk assets.
Attention now turns to Wednesday's CPI report. A stronger-than-expected inflation reading above 3.4% could revive rate-hike expectations and pressure stretched risk-on trends. Conversely, softer inflation could ease immediate tightening concerns, allowing any short-term correction to serve as a momentum reset rather than the beginning of a broader reversal.
Fear and Greed Index
Source: CNN
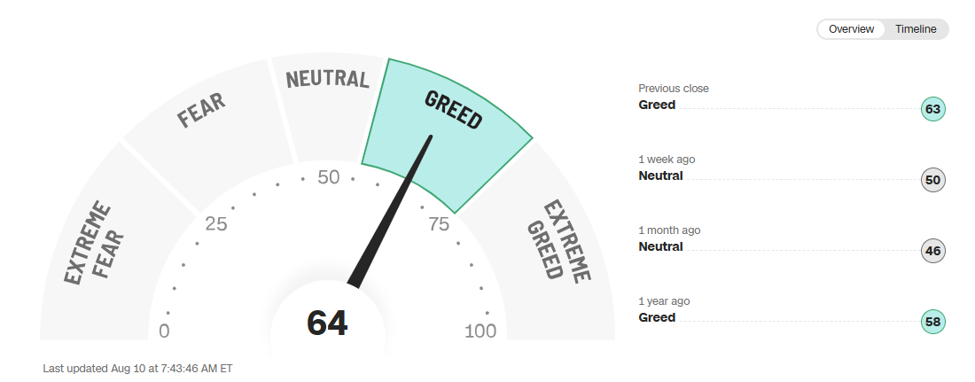
Despite slowing price momentum, overbought conditions on daily time frames, and persistent tensions surrounding the Strait of Hormuz, the Fear and Greed Index remains tilted toward risk appetite and continues to hold recent gains.
Key markets remain near elevated levels:
- Dow Jones: Near 54,000
- Gold: Near 4,370
- S&P 500: Near 7,770
Despite these strong rallies, several intermarket signals suggest investors continue to price in geopolitical uncertainty:
- The US Dollar Index (DXY) remains above its 2026 uptrend support near 99.30.
- WTI crude oil remains above $72 per barrel. Crude oil analysis
- Bitcoin continues to trade below $68,000 and within its June-August consolidation rather than confirming the broader risk-on move.
Together, these signals suggest caution remains warranted unless the dollar and crude oil continue to weaken while Bitcoin begins to confirm improving risk appetite.
Bitcoin Price Outlook: 3-Day Time Frame — Log Scale
Source: TradingView
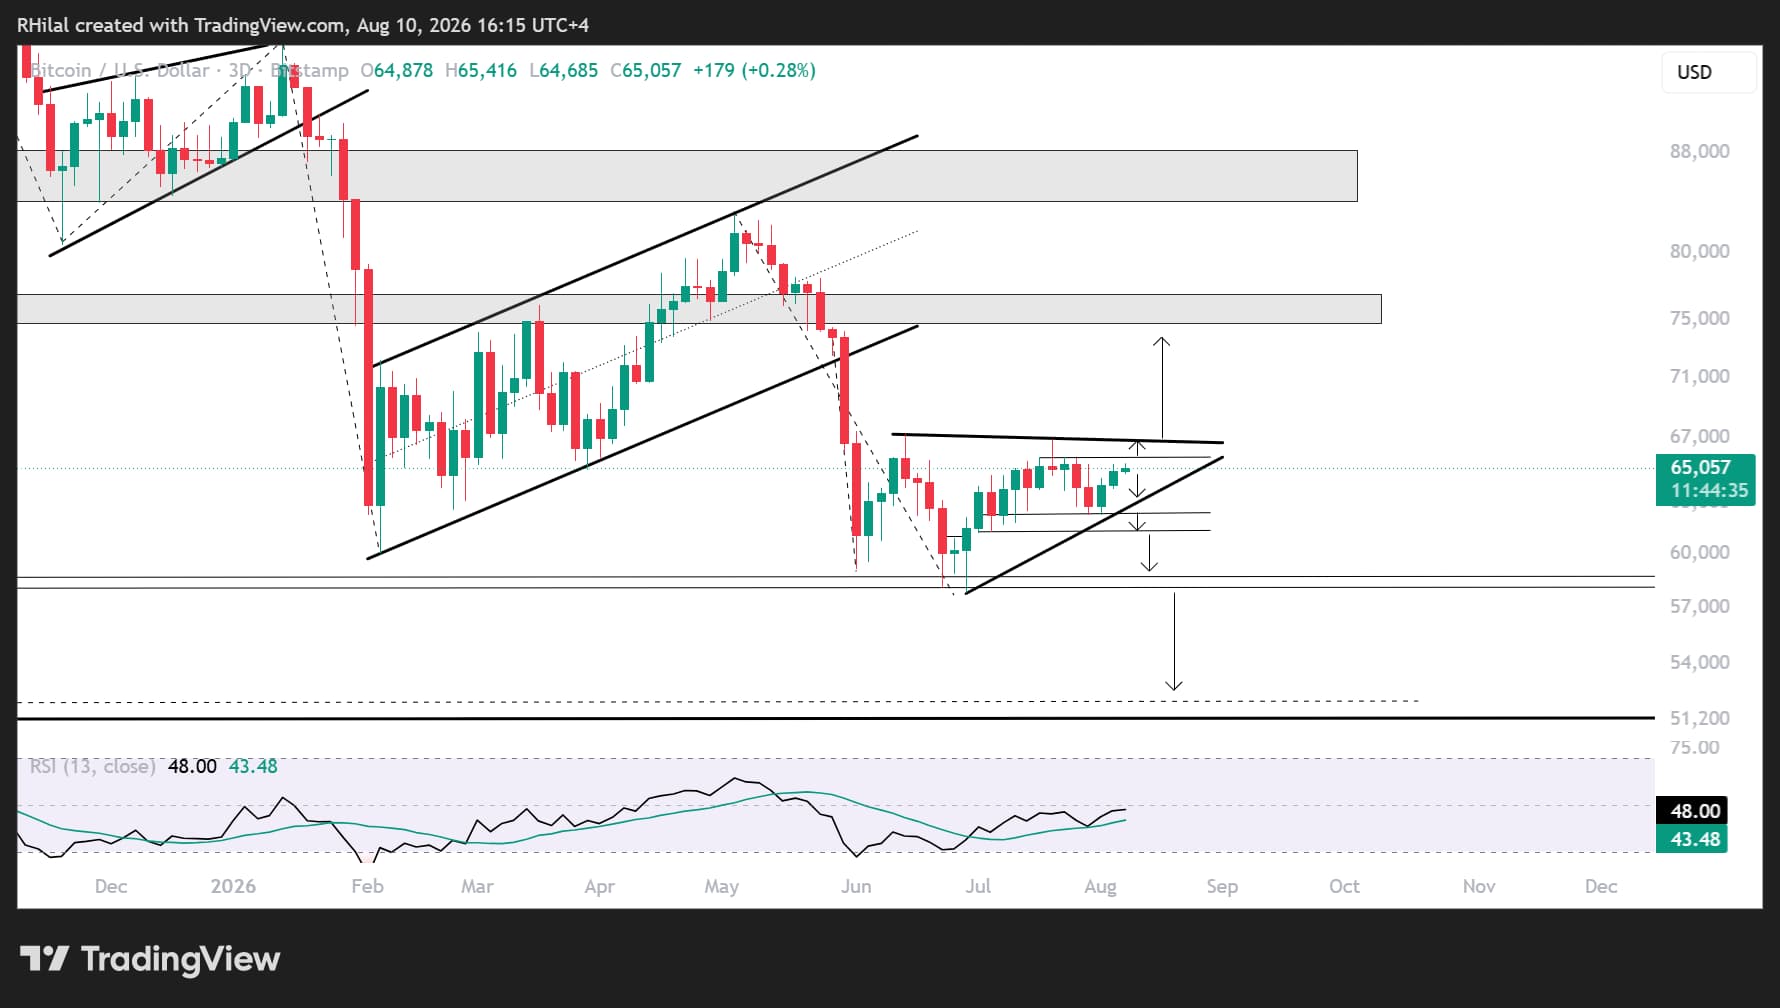
Bitcoin continues to trace a technical structure similar to those previously seen across precious metals, particularly gold and silver, forming a contracting consolidation near its 2026 lows between June and August.
A breakout above the upper boundary of this consolidation and the $68,000 resistance level would confirm strengthening momentum and expose the first upside objective near $74,000-$77,000, followed by $84,000-$88,000.
The latter represents a major long-term resistance zone, aligning with the 27.2% Fibonacci retracement of the 2025-2026 decline and serving as an important dividing line between the longer-term bullish and bearish outlooks.
Conversely, failure to break above $68,000 would leave Bitcoin vulnerable to another decline. A confirmed break below the $60,000-$58,000 support zone would expose the $49,000-$50,000 region, near the August 2025 lows, where another longer-term accumulation opportunity could emerge.
For now, Bitcoin's consolidation appears to represent a lagging accumulation phase awaiting broader confirmation that the recent improvement in global risk sentiment is becoming more sustainable.
Gold Price Outlook: Daily Time Frame — Log Scale
Source: TradingView
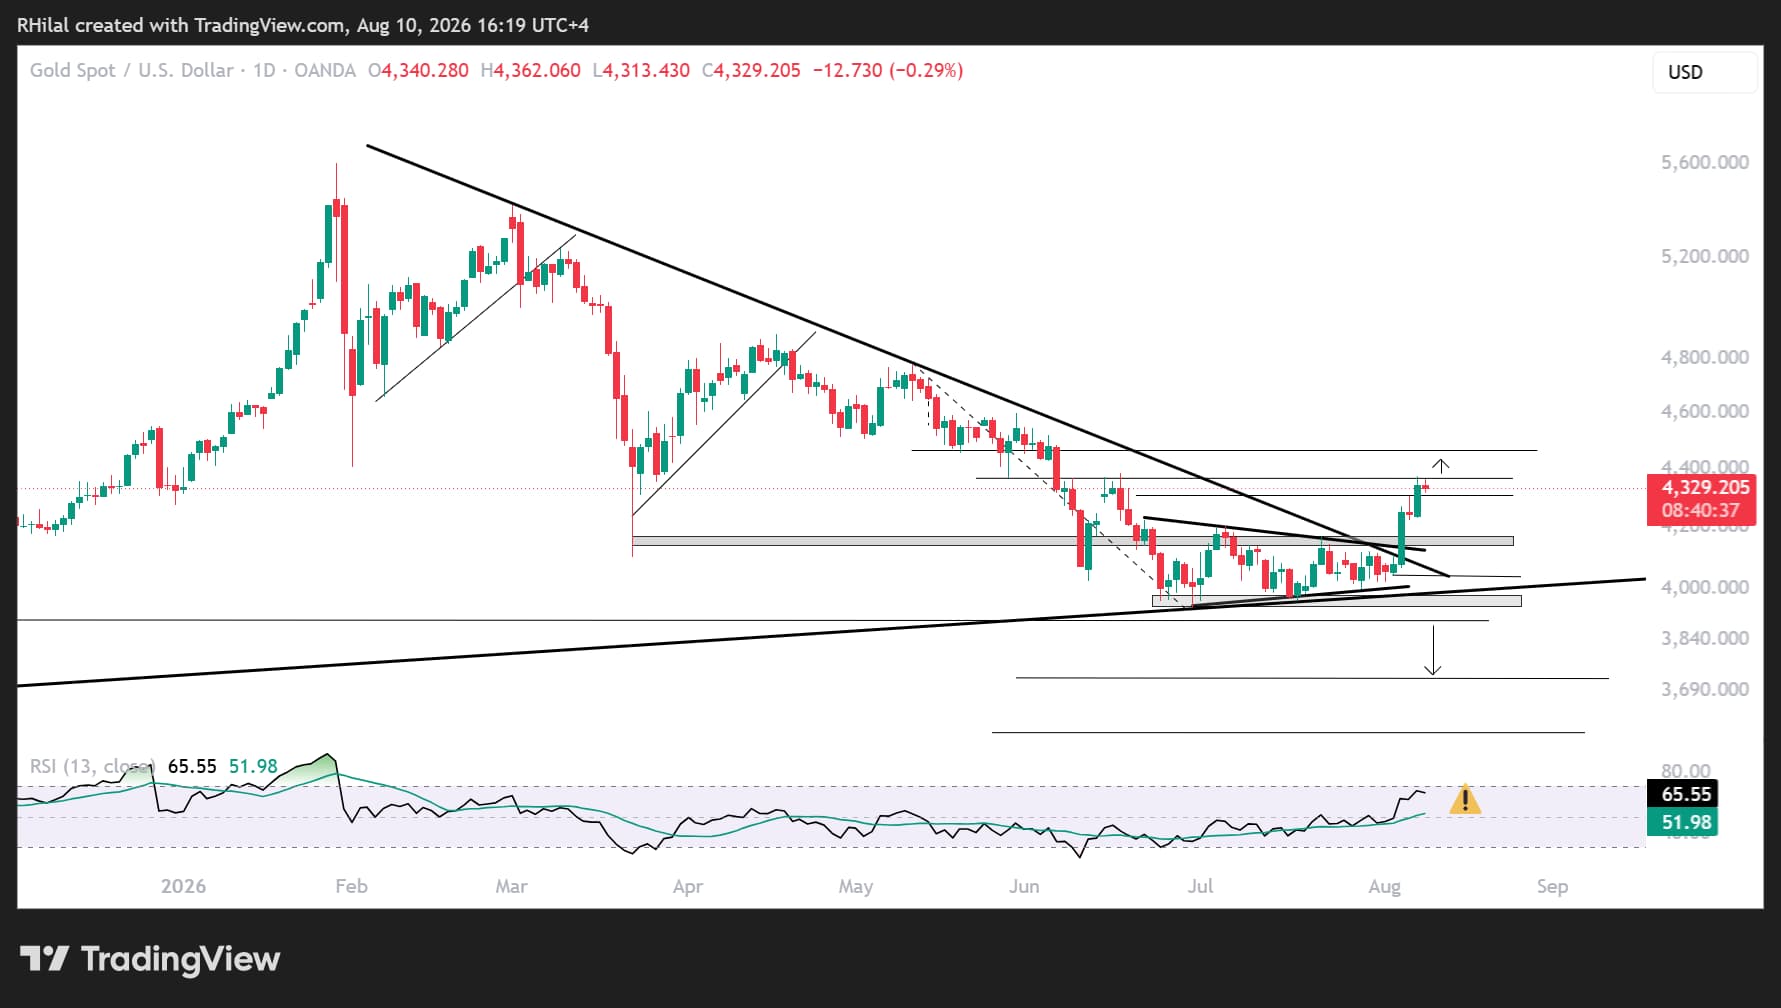
From a daily time frame perspective, gold is confirming a bullish breakout above its June-August contracting consolidation, previously ranging between 3,930 and 4,200, as well as above the descending resistance that had guided price action since March 2026.
Key support: 4,050-3,960-3,930
Gold Bullish Scenario
A sustained recovery above 4,370 and 4,470 would shift both the short- and longer-term outlooks further in favor of buyers. Such a move would strengthen the broader recovery case across precious metals and increase confidence that gold's longer-term uptrend has resumed.
However, the daily RSI continues to push deeper into overbought territory, reaching levels last seen in January 2026 when gold tested its 5,600 record high. This raises the risk of a short-term pullback or consolidation before another potential upside extension.
Gold Bearish Scenario
On the downside, a break below 4,300 and 4,200 would expose the 4,140-4,160 region as another potential dip-buying zone.
Should this area fail to hold, gold could retest the broader 4,050-3,960-3,930 support zone. A sustained break below this region would reactivate the broader bearish scenario.
The next downside objectives would be:
- 3,880-3,840: Corresponding to the October 2025 lows.
- 3,700
- 3,500-3,460: A well-respected five-month resistance zone throughout 2025 and the 38.2% Fibonacci retracement of the 1920-2026 advance.
These longer-term support zones could provide significant reversal opportunities should a deeper correction develop.
As long as the US Dollar Index and crude oil remain firm, downside and volatility risks across currencies and precious metals are likely to remain elevated.
Gold Price Outlook: 6-Month Time Frame — Log Scale
Source: TradingView
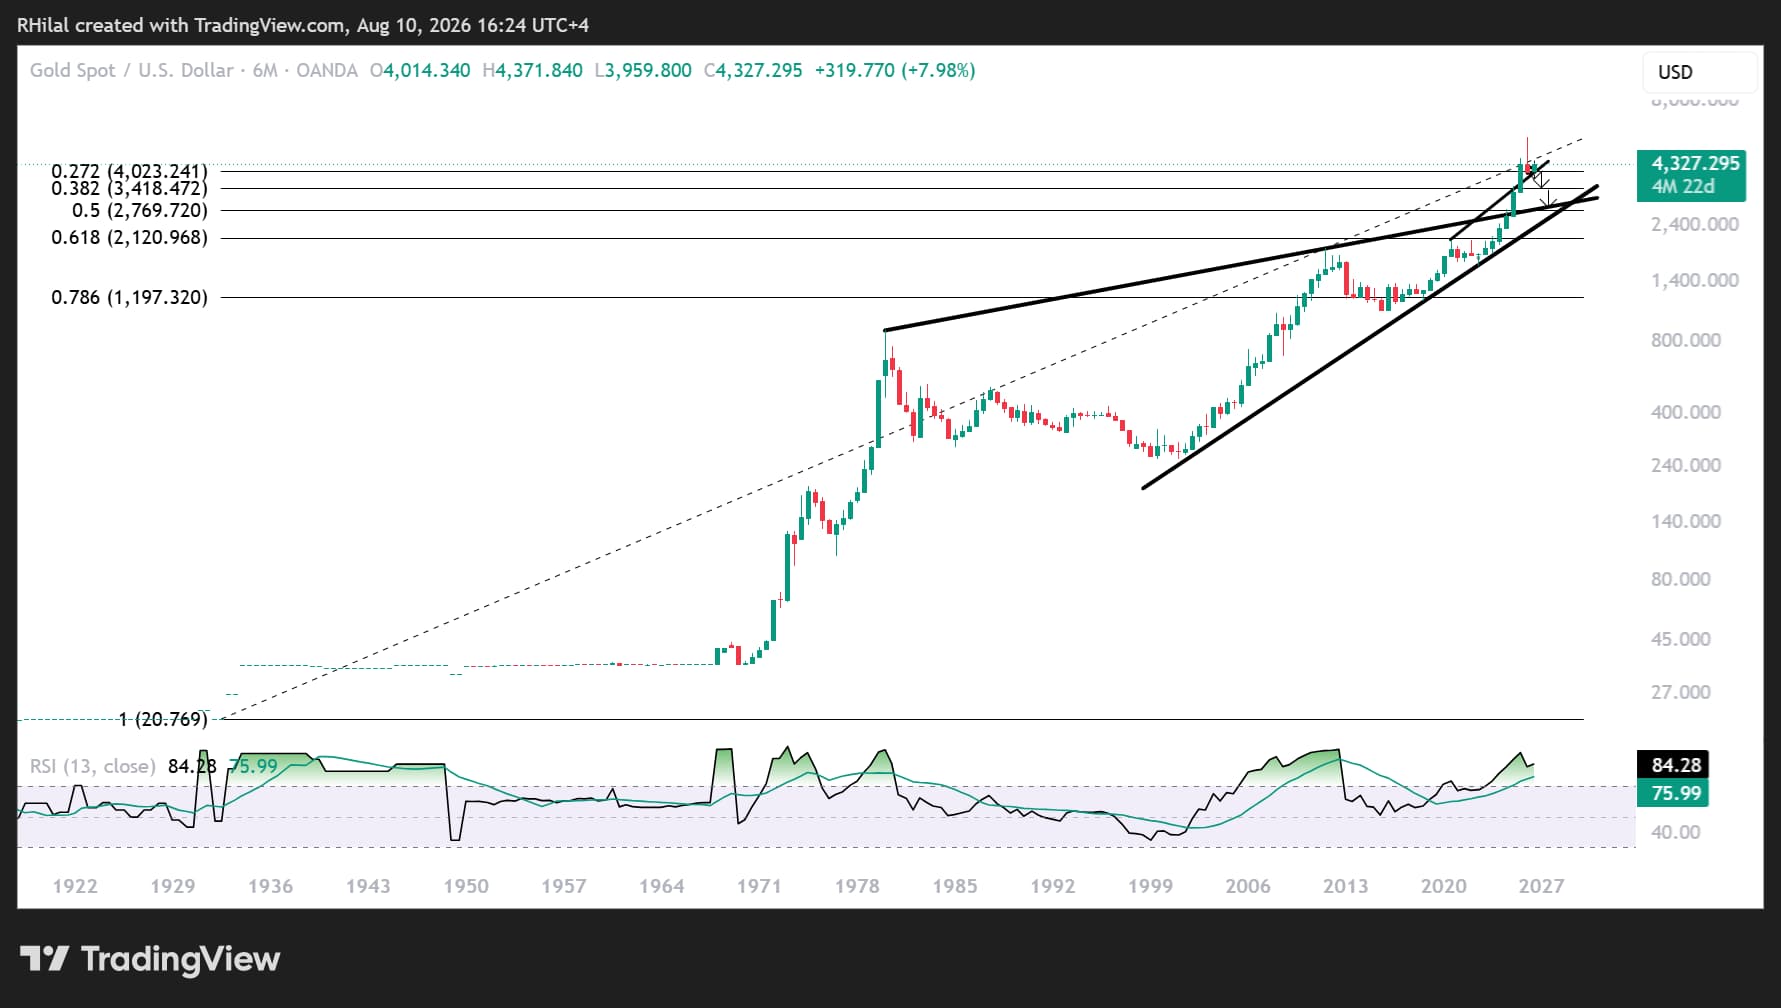
From a six-month perspective, gold is rebounding from one of its most significant long-term technical confluence zones in decades.
The area combines:
- The 27.2% Fibonacci retracement of the secular advance from 1920 to 2026.
- The long-term trendline connecting major highs between 2016 and 2025. What previously acted as resistance has now become one of gold's most important long-term support areas in 2026.
- The completion of a six-month shooting-star reversal pattern.
Given the significance of this support zone and the fragile US-Iran geopolitical backdrop, the longer-term structure remains particularly sensitive to a break below 3,930.
A sustained move below this technical confluence would expose the 38.2% Fibonacci retracement around 3,500-3,460, an area that acted as major resistance throughout much of 2025.
With gold, Bitcoin, the US Dollar Index, and major equity indices simultaneously approaching critical technical levels, Wednesday's US CPI report could provide an important catalyst for determining whether stretched risk-on trends extend or enter a broader corrective phase.
Written by Razan Hilal, CMT
Follow on X: @Rh_waves
Related tags:
Latest market news




Open an account in minutes
Experience award-winning platforms with fast and secure execution, and enjoy tight spreads from 0.5 pts on FX and 0.3 pts on indices.
Economic calendar
Web Trader platform
Our sophisticated web-based platform is packed with features.
Related articles
Euro Short-term Outlook: EUR/USD Selloff Nears Critical Yearly Support 9 23 2026
Euro has fallen seven of the past nine sessions, with stretched momentum raising the stakes as EUR/USD closes in on a major inflection zone.
Gold Analysis: Rising Yields and Dollar Strength Weigh on XAU/USD
The trading week continues, and for now gold remains under notable pressure in the short term. This can be seen in the performance of XAU/USD over the last three trading sessions, where the metal has declined by more than 2.00%, bringing a bearish bias back into focus after it had lost momentum in recent weeks.

Australian Dollar Technical Outlook: AUD/USD Breakdown Threatens Deeper Correction 9 23 2026
AUD/USD remains under pressure after breaking key trend support, with the latest decline putting the focus on the next major downside pivot.
This report is intended for general circulation only. It should not be construed as a recommendation, or an offer (or solicitation of an offer) to buy or sell any financial products. The information provided does not take into account your specific investment objectives, financial situation or particular needs. Before you act on any recommendation that may be contained in this report, independent advice ought to be sought from a financial adviser regarding the suitability of the investment product, taking into account your specific investment objectives, financial situation or particular needs.
StoneX Financial Pte. Ltd., may distribute reports produced by its respective foreign entities or affiliates within the StoneX group of companies or third parties pursuant to an arrangement under Regulation 32C of the Financial Advisers Regulations. Where the report is distributed to a person in Singapore who is not an accredited investor, expert investor or an institutional investor (as defined in the Securities Futures Act), StoneX Financial Pte. Ltd. accepts legal responsibility to such persons for the contents of the report only to the extent required by law. Singapore recipients should contact StoneX Financial Pte. Ltd. at 6826 9988 for matters arising from, or in connection with the report.
In the case of all other recipients of this report, to the extent permitted by applicable laws and regulations neither StoneX Financial Pte. Ltd. nor its associated companies will be responsible or liable for any loss or damage incurred arising out of, or in connection with, any use of the information contained in this report and all such liability is hereby expressly disclaimed. No representation or warranty is made, express or implied, that the content of this report is complete or accurate.
StoneX Financial Pte. Ltd. is not under any obligation to update this report.
Trading CFDs carries a high level of risk that may not be suitable for some investors. Consider your investment objectives, level of experience, financial resources, risk appetite and other relevant circumstances carefully. The possibility exists that you could lose some or all of your investments, including your initial deposits. If in doubt, please seek independent expert advice. Visit www.forex.com/en-sg/terms-and-policies for the complete Risk Disclosure Statement.