




CPI data Buy the Rumor Sell the Fact DXY EURUSD
While it is true that March’s print is much stronger, the YoY data is distorted.
Share this:

The US March CPI headline YoY print was 2.6% vs 1.7% in February. 2.5% was expected. While it is true that March’s print is much stronger, the YoY data is distorted. Recall that between March and May last year, businesses were closing their doors and lockdowns were in place for much of the US. The CPI prints were dismal. That data has skewed the YoY print and is one of the main reasons the Fed says that the data is “hard to read” or that it is “transitory”. The core CPI YoY print was not as dramatic, coming in at 1.6% vs 1.3% in February and 1.5% expected. The headline MoM print was also slightly higher at 0.6% vs 0.4% in February and 0.5% expected.
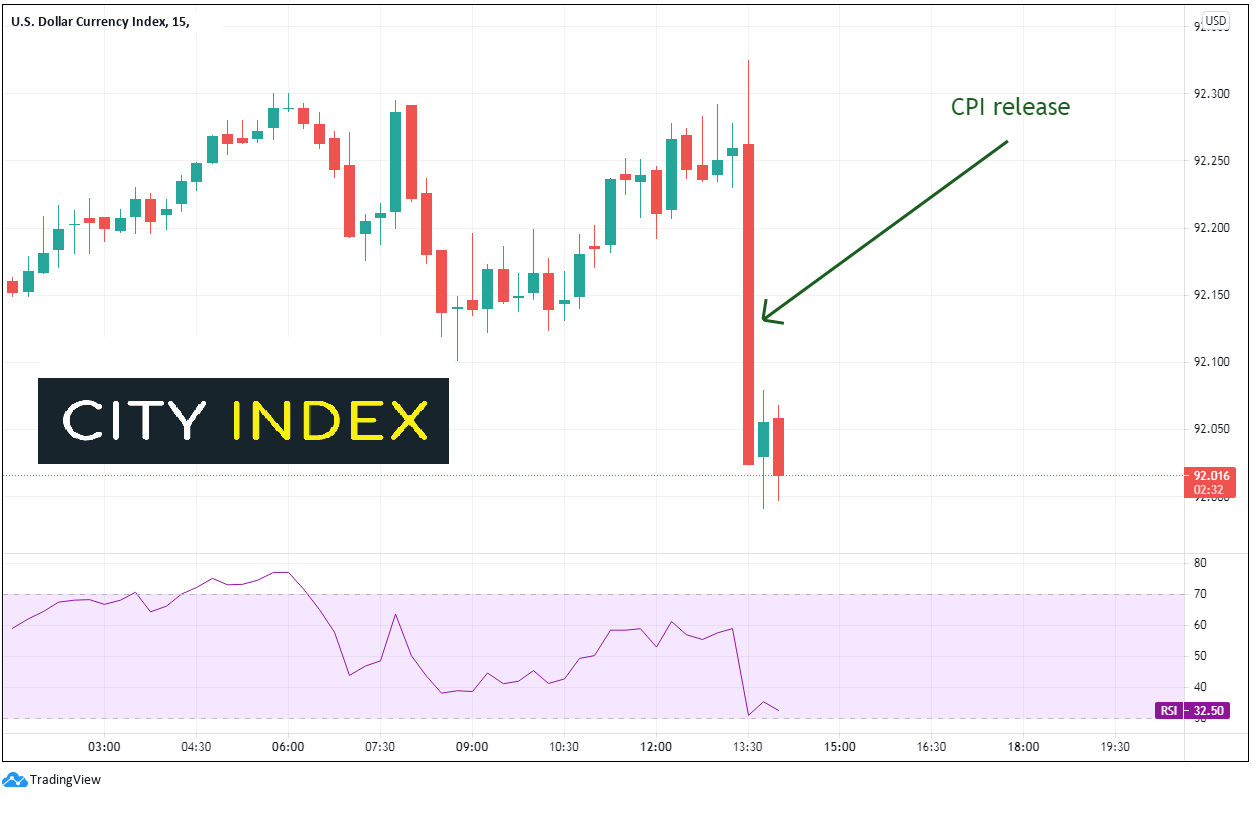
Traders read right through the seemingly dramatic jump in the consumer price index. One could expect that a reading such as this would send stocks lower, with yields and the US Dollar moving higher. However, economists telegraphed the number well in advance. Therefore, traders reacted in a “buy the rumor, sell the fact” manner. The US Dollar Index (DXY) moved from 92.26 down to 92.03 within the first 15 minutes after the print.
Source: Tradingview, City Index
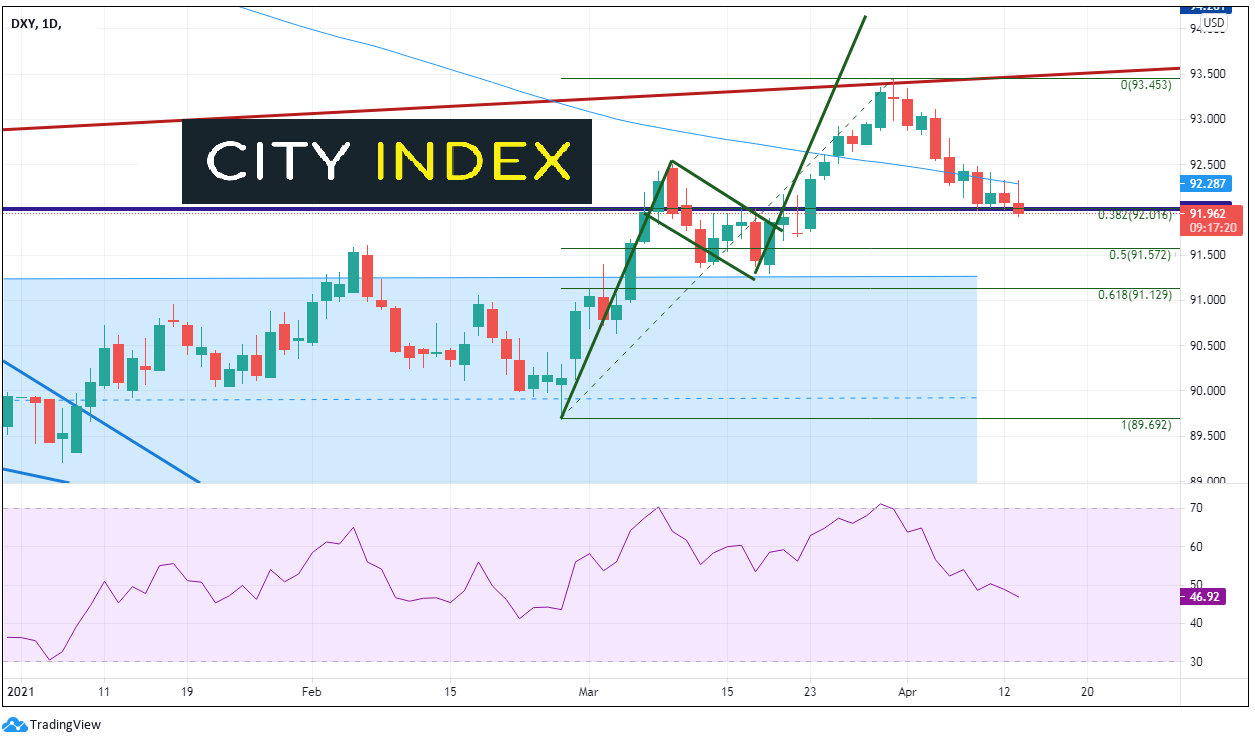
The selling was too much for buyers to overcome at the 38.2% Fibonacci retracement from the February 25th lows to the March 31st highs, as well as horizontal support. A close above 92.00 would still give bulls hope for a move higher on a daily timeframe. The 50% retracement from the same timeframe is first support at 91.57. Resistance is near the 200 Day Average and today’s highs near 92.30. March 18th lows and the top of a large band of support is the next level of support near 91.30.
Source: Tradingview, City Index
As one may suspect, with the DXY moving lower, EUR/USD has moved higher. Within 15 minutes of the data, EUR/USD moved from 1.1894 to 1.1927.
Source: Tradingview, City Index
On the move higher, EUR/USD pushed to its highest level since March 23rd. It has moved above the 38.2% Fibonacci retracement level from the February 25th highs to the March 31st lows at 1.1908 horizontal resistance. The next level of resistance is at the 50% retracement level from the same timeframe, near 1.1970, and then March 18th highs of 1.1989. Support below is at the 200 Day Moving Average and todays lows between 1.1876 and 1.1893.
Source: Tradingview, City Index
The jump in headline CPI was dramatic, no mistake about it. However, it was expected well in advance due to distortions from the pandemic data 1 year ago. Expect many of the upcoming YoY data prints to be similar. But these numbers will be expected well in advance, don’t get caught on the wrong side of that line!
Learn more about forex trading opportunities.
The US March CPI headline YoY print was 2.6% vs 1.7% in February. 2.5% was expected. While it is true that March’s print is much stronger, the YoY data is distorted. Recall that between March and May last year, businesses were closing their doors and lockdowns were in place for much of the US. The CPI prints were dismal. That data has skewed the YoY print and is one of the main reasons the Fed says that the data is “hard to read” or that it is “transitory”. The core CPI YoY print was not as dramatic, coming in at 1.6% vs 1.3% in February and 1.5% expected. The headline MoM print was also slightly higher at 0.6% vs 0.4% in February and 0.5% expected.
Traders read right through the seemingly dramatic jump in the consumer price index. One could expect that a reading such as this would send stocks lower, with yields and the US Dollar moving higher. However, economists telegraphed the number well in advance. Therefore, traders reacted in a “buy the rumor, sell the fact” manner. The US Dollar Index (DXY) moved from 92.26 down to 92.03 within the first 15 minutes after the print.
Source: Tradingview, FOREX.com
The selling was too much for buyers to overcome at the 38.2% Fibonacci retracement from the February 25th lows to the March 31st highs, as well as horizontal support. A close above 92.00 would still give bulls hope for a move higher on a daily timeframe. The 50% retracement from the same timeframe is first support at 91.57. Resistance is near the 200 Day Average and today’s highs near 92.30. March 18th lows and the top of a large band of support is the next level of support near 91.30.
Source: Tradingview, FOREX.com
As one may suspect, with the DXY moving lower, EUR/USD has moved higher. Within 15 minutes of the data, EUR/USD moved from 1.1894 to 1.1927.
Source: Tradingview, FOREX.com
On the move higher, EUR/USD pushed to its highest level since March 23rd. It has moved above the 38.2% Fibonacci retracement level from the February 25th highs to the March 31st lows at 1.1908 horizontal resistance. The next level of resistance is at the 50% retracement level from the same timeframe, near 1.1970, and then March 18th highs of 1.1989. Support below is at the 200 Day Moving Average and todays lows between 1.1876 and 1.1893.
Source: Tradingview, FOREX.com
The jump in headline CPI was dramatic, no mistake about it. However, it was expected well in advance due to distortions from the pandemic data 1 year ago. Expect many of the upcoming YoY data prints to be similar. But these numbers will be expected well in advance, don’t get caught on the wrong side of that line!
Related tags:
Latest market news




Open an account in minutes
Experience award-winning platforms with fast and secure execution, and enjoy tight spreads from 0.5 pts on FX and 0.3 pts on indices.
Economic calendar
Web Trader platform
Our sophisticated web-based platform is packed with features.
Related articles
GBP/USD forecast: US dollar surges as bonds implode
The US dollar continued to press higher deep into the European session, supported by the slump in the bond markets as yields broke out across the curve. Following the recent hawkish Fed rate hike, yield spreads between the US and the rest of the world has continually increased, and that motion continued today, helped in part by some forecast-beating US macro data and hawkish Fed commentary.
Australian Dollar Technical Outlook: AUD/USD Breakdown Threatens Deeper Correction 9 23 2026
AUD/USD remains under pressure after breaking key trend support, with the latest decline putting the focus on the next major downside pivot.


USD/JPY forecast: US dollar strengths amid hawkish Fed despite recent oil weakness
The US dollar has extended its gains this morning, even if oil prices finished lower for the fifth consecutive day yesterday. Oil prices have bounced back in this first half of today’s session, causing a bit of pressure on currencies that rely on energy imports such as the euro, pound, Swiss franc, and Japanese yen. But it was the dollar that was exerting the most pressure, amid hawkish FedSpeak. Meanwhile, European indices and precious metals were also under a bit of pressure amid the strength of the dollar.
This report is intended for general circulation only. It should not be construed as a recommendation, or an offer (or solicitation of an offer) to buy or sell any financial products. The information provided does not take into account your specific investment objectives, financial situation or particular needs. Before you act on any recommendation that may be contained in this report, independent advice ought to be sought from a financial adviser regarding the suitability of the investment product, taking into account your specific investment objectives, financial situation or particular needs.
StoneX Financial Pte. Ltd., may distribute reports produced by its respective foreign entities or affiliates within the StoneX group of companies or third parties pursuant to an arrangement under Regulation 32C of the Financial Advisers Regulations. Where the report is distributed to a person in Singapore who is not an accredited investor, expert investor or an institutional investor (as defined in the Securities Futures Act), StoneX Financial Pte. Ltd. accepts legal responsibility to such persons for the contents of the report only to the extent required by law. Singapore recipients should contact StoneX Financial Pte. Ltd. at 6826 9988 for matters arising from, or in connection with the report.
In the case of all other recipients of this report, to the extent permitted by applicable laws and regulations neither StoneX Financial Pte. Ltd. nor its associated companies will be responsible or liable for any loss or damage incurred arising out of, or in connection with, any use of the information contained in this report and all such liability is hereby expressly disclaimed. No representation or warranty is made, express or implied, that the content of this report is complete or accurate.
StoneX Financial Pte. Ltd. is not under any obligation to update this report.
Trading CFDs carries a high level of risk that may not be suitable for some investors. Consider your investment objectives, level of experience, financial resources, risk appetite and other relevant circumstances carefully. The possibility exists that you could lose some or all of your investments, including your initial deposits. If in doubt, please seek independent expert advice. Visit www.forex.com/en-sg/terms-and-policies for the complete Risk Disclosure Statement.