




Gold Intraday Rebound Thanks to Donald Trump
U.S. President Donald Trump said in a Fox News interview China "made a horrible mistake" which caused the coronavirus pandemic...
Share this:

Just as gold price was heading downward due to the diminishing coronavirus fears, U.S. President Donald Trump said on a Fox News interview China "made a horrible mistake" which caused the coronavirus pandemic, and "they tried to cover it". Meanwhile, Bloomberg reported that Trump is considering plans to block a government retirement fund from investing 50 billion dollars in China stock markets.
Some analysts are already pointing out that Trump could attempt to diverge attention to China's fault on coronavirus outbreak, as a 2020 presidential election strategy. If he carries on lighting up tensions between the two nations, gold may be benefited.
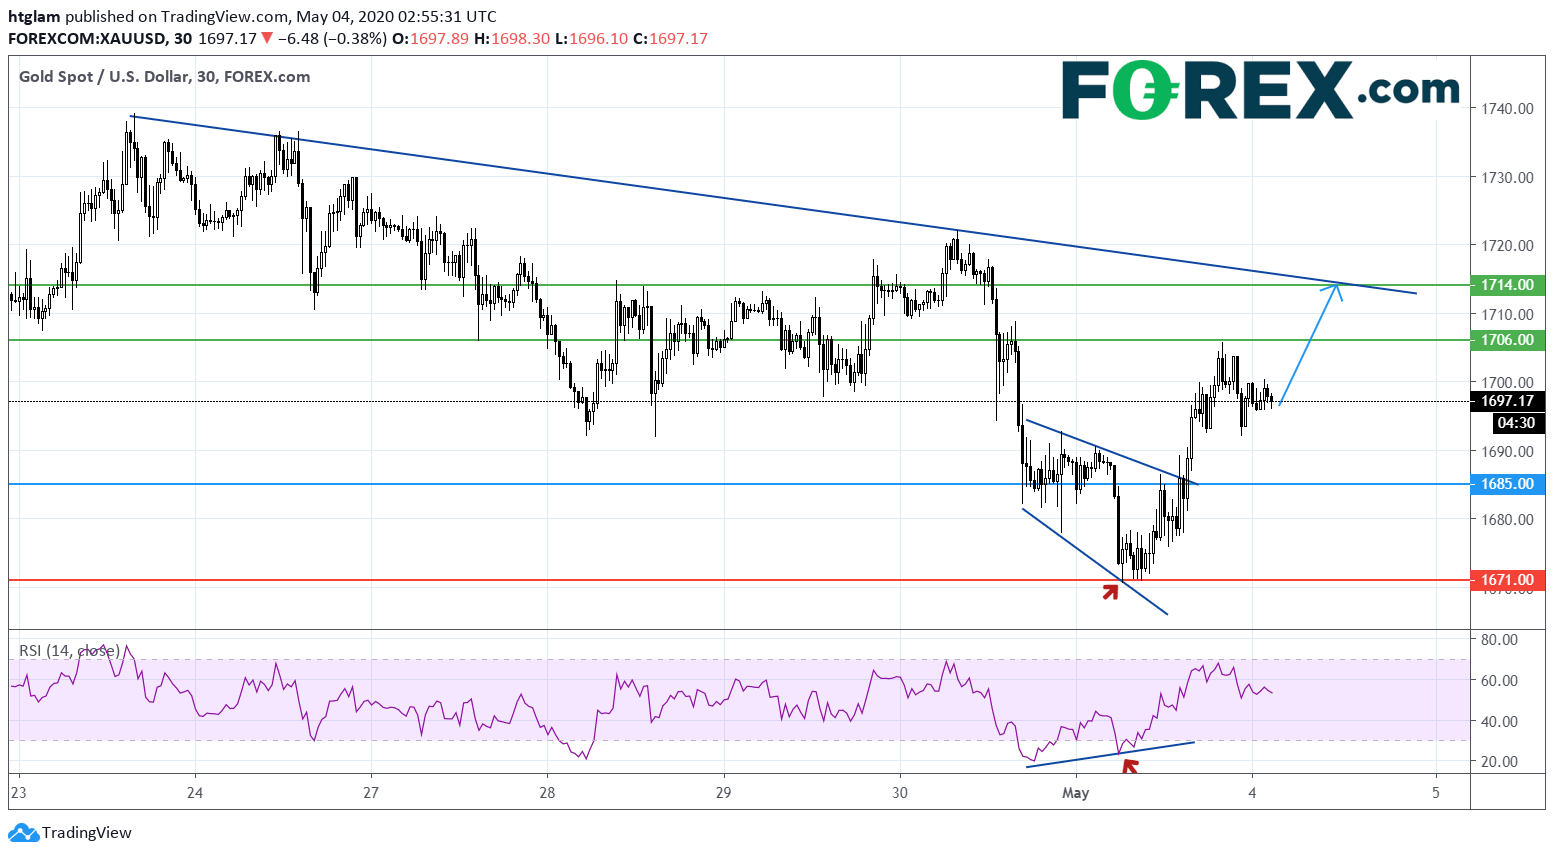
From a technical point of view, spot gold is gaining traction as shown on the 1-hour chart. It has broken above a falling wedge pattern, while the RSI has shown a bullish divergence. The level at $1,685 may be considered as the nearest support, and a break above the nearest resistance at $1,706 is likely to trigger a further advance to test the next resistance at $1,714. In an alternative scenario, losing $1,685 might show that gold has lost momentum and the next support at $1,671 could be threatened.
Source: TradingView, Gain Capital
Just as gold price was heading downward due to the diminishing coronavirus fears, U.S. President Donald Trump said on a Fox News interview China "made a horrible mistake" which caused the coronavirus pandemic, and "they tried to cover it". Meanwhile, Bloomberg reported that Trump is considering plans to block a government retirement fund from investing 50 billion dollars in China stock markets.
Some analysts are already pointing out that Trump could attempt to diverge attention to China's fault on coronavirus outbreak, as a 2020 presidential election strategy. If he carries on lighting up tensions between the two nations, gold may be benefited.
From a technical point of view, spot gold is gaining traction as shown on the 1-hour chart. It has broken above a falling wedge pattern, while the RSI has shown a bullish divergence. The level at $1,685 may be considered as the nearest support, and a break above the nearest resistance at $1,706 is likely to trigger a further advance to test the next resistance at $1,714. In an alternative scenario, losing $1,685 might show that gold has lost momentum and the next support at $1,671 could be threatened.
Source: TradingView, Gain Capital
Related tags:
Latest market news




Open an account in minutes
Experience award-winning platforms with fast and secure execution, and enjoy tight spreads from 0.5 pts on FX and 0.3 pts on indices.
Economic calendar
Web Trader platform
Our sophisticated web-based platform is packed with features.
Related articles
Gold Analysis: Rising Yields and Dollar Strength Weigh on XAU/USD
The trading week continues, and for now gold remains under notable pressure in the short term. This can be seen in the performance of XAU/USD over the last three trading sessions, where the metal has declined by more than 2.00%, bringing a bearish bias back into focus after it had lost momentum in recent weeks.


EUR/USD, Gold Forecast: Two trades to watch
EUR/USD falls to a 2-month low despite Eurozone growth picking up. Gold under pressure as a stronger USD offsets falling oil prices.


Gold Holds Firm Despite Stronger US Dollar and Hawkish Fed
Gold remains resilient despite a stronger US dollar and hawkish Fed rhetoric, while DXY momentum shows signs of fading near resistance.

This report is intended for general circulation only. It should not be construed as a recommendation, or an offer (or solicitation of an offer) to buy or sell any financial products. The information provided does not take into account your specific investment objectives, financial situation or particular needs. Before you act on any recommendation that may be contained in this report, independent advice ought to be sought from a financial adviser regarding the suitability of the investment product, taking into account your specific investment objectives, financial situation or particular needs.
StoneX Financial Pte. Ltd., may distribute reports produced by its respective foreign entities or affiliates within the StoneX group of companies or third parties pursuant to an arrangement under Regulation 32C of the Financial Advisers Regulations. Where the report is distributed to a person in Singapore who is not an accredited investor, expert investor or an institutional investor (as defined in the Securities Futures Act), StoneX Financial Pte. Ltd. accepts legal responsibility to such persons for the contents of the report only to the extent required by law. Singapore recipients should contact StoneX Financial Pte. Ltd. at 6826 9988 for matters arising from, or in connection with the report.
In the case of all other recipients of this report, to the extent permitted by applicable laws and regulations neither StoneX Financial Pte. Ltd. nor its associated companies will be responsible or liable for any loss or damage incurred arising out of, or in connection with, any use of the information contained in this report and all such liability is hereby expressly disclaimed. No representation or warranty is made, express or implied, that the content of this report is complete or accurate.
StoneX Financial Pte. Ltd. is not under any obligation to update this report.
Trading CFDs carries a high level of risk that may not be suitable for some investors. Consider your investment objectives, level of experience, financial resources, risk appetite and other relevant circumstances carefully. The possibility exists that you could lose some or all of your investments, including your initial deposits. If in doubt, please seek independent expert advice. Visit www.forex.com/en-sg/terms-and-policies for the complete Risk Disclosure Statement.