



Weekly Equities Outlook: Tesla, Intel, IBM
Earnings ramp up this week with Tesla, Intel and IBM in focus.
Share this:

Tesla Q1 Earnings Preview
Tesla is due to report earnings on April 22. This comes as the share price has had a challenging start to the year following a strong 2025. The stock is down around 25% year-to-date, significantly underperforming the broader market. Sentiment has been weighed down by concerns around the US–Iran conflict, softer vehicle demand, and rising capital expenditure linked to AI and infrastructure investment.
Consensus expectations are for EPS of $0.36, up from $0.27 a year ago. Investors will be watching closely for updates on robotaxi expansion and self-driving, which are widely seen as key long-term growth drivers.
In Q4, Tesla beat expectations, posting EPS of $0.50 versus $0.45 expected, on revenue of $24.9 billion (slightly down year-on-year but ahead of forecasts). Q1 deliveries came in at 358,023 vehicles, below expectations of around 365,000, although still reflecting modest year-on-year growth.
Margins remain under pressure due to elevated R&D spending and Tesla’s transition towards higher-margin, software-driven AI products. While the long-term robotics and AI thesis remains intact, near-term volatility is likely as investors weigh slowing EV growth against heavy investment.
How to trade TSLA earnings?
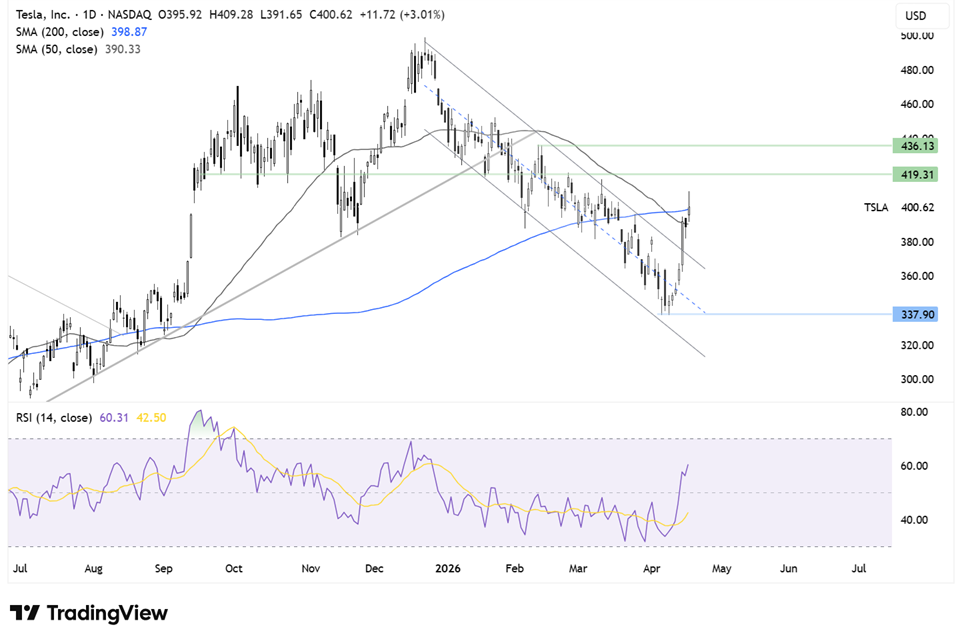
Tesla has broken out of a falling channel from mid-December, rebounding from the 346 low and moving above the 50-day SMA. The price is now testing resistance at the 200-day SMA near 400. A sustained break higher could open the door to 420, then 436 (February high), and 470 (October high). Support sits around the 50-day SMA.
Intel Q1 Earnings Preview
Intel is set to report earnings on April 23 after the close, with the stock rallying sharply—up around 90% this year following 84% gains in 2025.
Revenue is expected in the range of $11.7–$12.7 billion, marking a sequential decline from $13.7 billion in Q4. Intel remains in the midst of a multi-year turnaround effort to restore technological leadership after losing market share to competitors such as AMD.
Improving sentiment has been driven by several developments, including strategic deals and increased involvement in AI-related semiconductor projects linked to Elon Musk’s ecosystem (Tesla, SpaceX, and xAI). These provide near-term catalysts for the stock.
However, risks remain. Supply constraints continue to weigh on the outlook, with management indicating tight supply in Q1 before potential improvement in Q2. Additionally, the cost of Intel’s transformation into a leading AI foundry is substantial, raising concerns over capital expenditure. The bullside to this is that the increase spending will lead to a sharp rise in revenue.
How to trade INTC earnings?
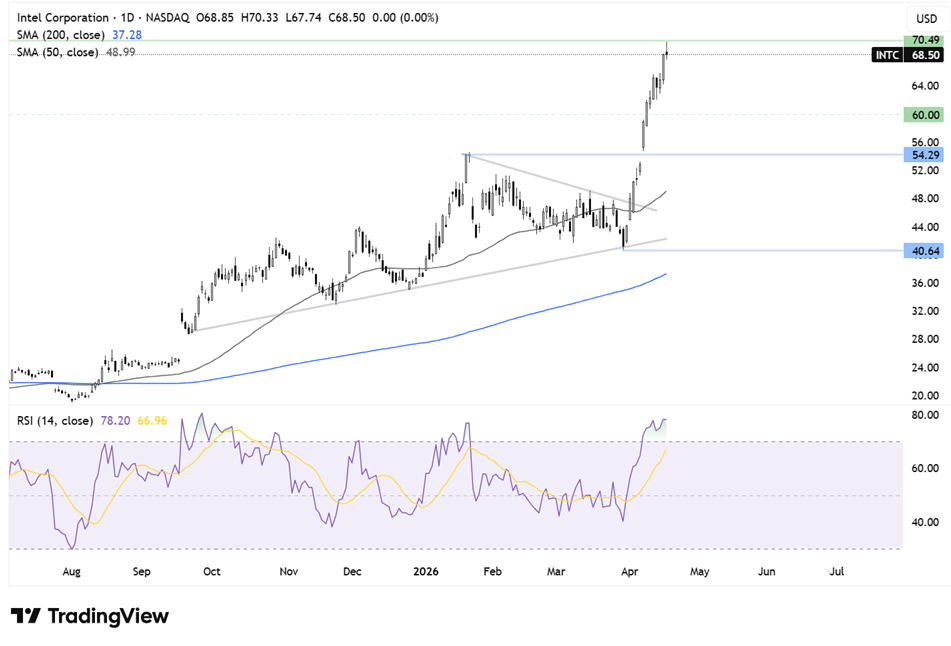
Intel has rebounded strongly from its 40.60 low, breaking trendline resistance and rallying sharply to 70.33 a multi-decade high. However, RSI is in overbought territory, and recent price action suggests potential exhaustion.
Minor support is seen around 60.00, the round number and then 55.00 (January high).
A break above recent highs could open the path towards 75 to 2000 peak.
IBM Earnings Preview
IBM is expected to report adjusted EPS of $1.81 on revenue of $15.64 billion, up from $1.60 and $14.54 billion a year ago.
Expectations heading into the release are cautiously optimistic, with investors focused on IBM’s growing AI narrative. Strength is expected from software and infrastructure segments, particularly in automation and transaction processing, highlighting resilience even as parts of the hybrid cloud business slow.
AI remains central to the investment case. IBM has been expanding its AI and automation offerings, particularly across enterprise, government, and cybersecurity applications, reinforcing its positioning in higher-value segments.
How to trade IBM earnings?
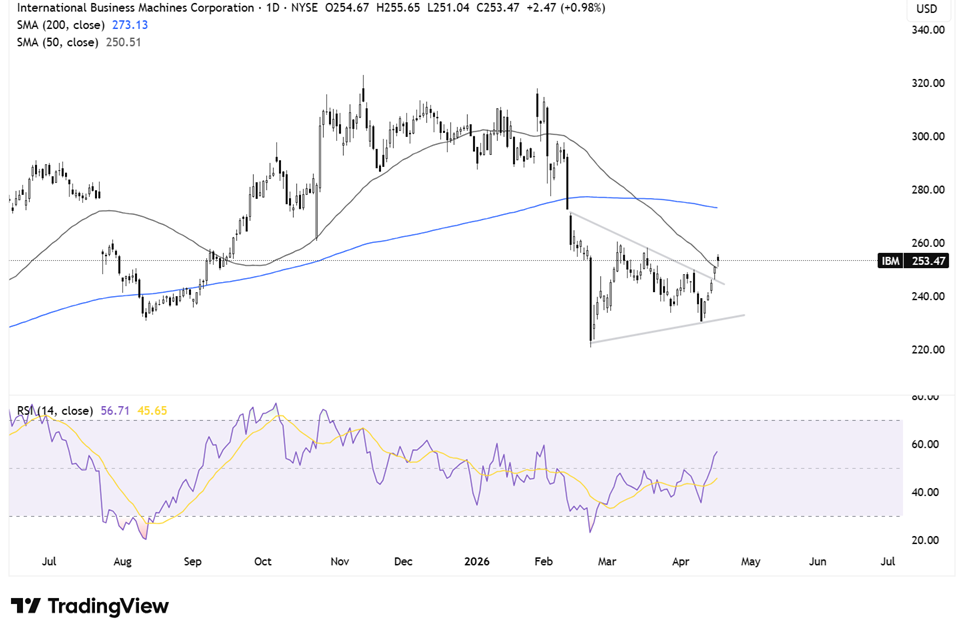
IBM has broken out of a symmetrical triangle pattern, rising from 230 and moving above the 50-day SMA towards 255. Momentum remains constructive, with RSI above 50. A move higher could target the 200-day SMA near 272. Support is seen at 250 (50-day SMA) and 245 (trendline support). A break below 230 would signal a more bearish shift.
Related tags:
Latest market news



Open an account in minutes
Experience award-winning platforms with fast and secure execution, and enjoy tight spreads from 0.5 pts on FX and 0.3 pts on indices.
Economic calendar
Web Trader platform
Our sophisticated web-based platform is packed with features.
Related articles
Weekly Equities Outlook: Nike, Micron Technology, Carnival Corp.
Earnings from Nike comes as the share price trades at a 12-year low. Micron Technology keeps the AI trade in focus and Carnival suffers from rising fuel costs.

Weekly Equities Forecast: Costco, JD Sports & Strategy
Earnings Costco, JD Sports report earnings and crypto stocks are in focus with after Friday's SEC announcement which boosted BTC.
Weekly Equities Outlook: JPMorgan, Next and BP
JPMorgan in focus with the Fed rate decision. Next keeps consumer discretionary under the spotlight with the BoE rate decision. BP and energy stocks supported by elevated oil prices.
This report is intended for general circulation only. It should not be construed as a recommendation, or an offer (or solicitation of an offer) to buy or sell any financial products. The information provided does not take into account your specific investment objectives, financial situation or particular needs. Before you act on any recommendation that may be contained in this report, independent advice ought to be sought from a financial adviser regarding the suitability of the investment product, taking into account your specific investment objectives, financial situation or particular needs.
StoneX Financial Pte. Ltd., may distribute reports produced by its respective foreign entities or affiliates within the StoneX group of companies or third parties pursuant to an arrangement under Regulation 32C of the Financial Advisers Regulations. Where the report is distributed to a person in Singapore who is not an accredited investor, expert investor or an institutional investor (as defined in the Securities Futures Act), StoneX Financial Pte. Ltd. accepts legal responsibility to such persons for the contents of the report only to the extent required by law. Singapore recipients should contact StoneX Financial Pte. Ltd. at 6826 9988 for matters arising from, or in connection with the report.
In the case of all other recipients of this report, to the extent permitted by applicable laws and regulations neither StoneX Financial Pte. Ltd. nor its associated companies will be responsible or liable for any loss or damage incurred arising out of, or in connection with, any use of the information contained in this report and all such liability is hereby expressly disclaimed. No representation or warranty is made, express or implied, that the content of this report is complete or accurate.
StoneX Financial Pte. Ltd. is not under any obligation to update this report.
Trading CFDs carries a high level of risk that may not be suitable for some investors. Consider your investment objectives, level of experience, financial resources, risk appetite and other relevant circumstances carefully. The possibility exists that you could lose some or all of your investments, including your initial deposits. If in doubt, please seek independent expert advice. Visit www.forex.com/en-sg/terms-and-policies for the complete Risk Disclosure Statement.