




What happened at OPEC and what now for oil prices
OPEC has an uncanny ability to prompt volatility and did so again overnight as the group failed to reach an agreement that would increase supply and curb surging prices.
Share this:

The NBS manufacturing PMI declined to 50.9 in June from 51.0 in May. A reflection of a slowdown in export growth momentum due to the Covid disruption on Shenzhen ports, nationwide safety inspections ahead of July 1st (the 100th anniversary of the Communist Party) as well as power and chip shortages.
The non-manufacturing PMI dropped to 53.5 from 55.2 as the Covid resurgence weighed on services in particular air travel, accommodation, and catering services.
As a result of the softer PMI data today, it is likely 2Q GDP will fall below 8% and bring with it policy fine-tuning, including faster local government bond issuance.
What does this mean for the RMB?
The RMB has been on the back foot against the US dollar since May after the PBOC pushed back against further appreciation via verbal guidance, a RRR hike on FX forwards, and higher QDII quotas.
The hawkish shift by the Federal Reserve two weeks ago sent the RMB lower again, as USDCNY rallied from below 6.4000 up to a high of 6.4895.
Technically the chart most important for USDCNY at this point is the monthly chart viewed below.
Should USDCNY close this evening (June 30) above 6.4600ish it would indicate the decline to the 6.3572 low was a false break lower below the trendline support from the 2014, 6.0402 low. And that USDCNY has completed a five-wave impulsive decline from the September 2019 high, above 7.1800
In this instance, the expectation would be for a stronger recovery in USDCNY towards 6.6000 in the coming weeks and traders may consider long USDCNY positions using the May 6.3572 low as the bullish reassessment level.
Source Tradingview. The figures stated areas of the 30th of June 2021. Past performance is not a reliable indicator of future performance. This report does not contain and is not to be taken as containing any financial product advice or financial product recommendation
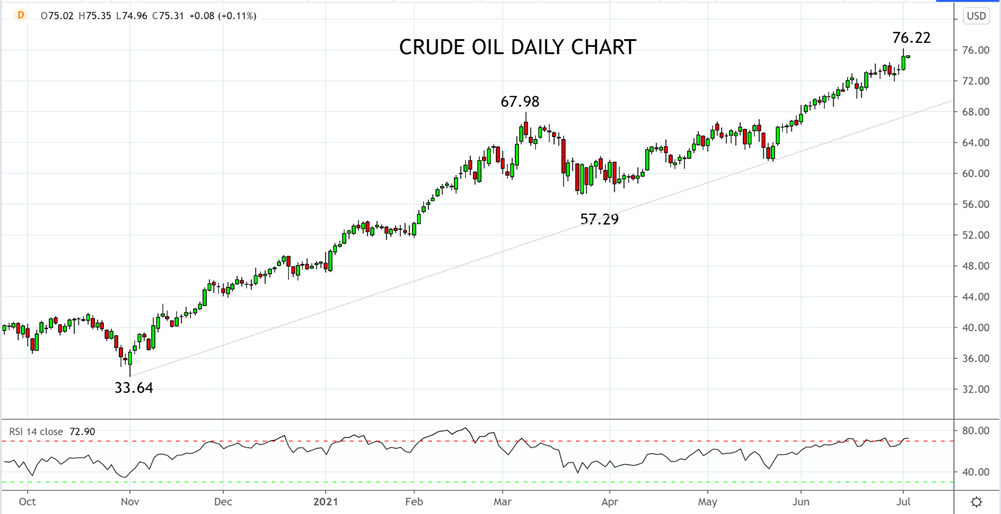
Headlines released at around 10 am EST time (midnight AEST) indicated Saudi Arabia and Russia had agreed to a lower than expected 400kb monthly increase each month to December, for a total hike of 2mb sent crude oil prices $2.50 higher, to $76.22.
Only to see prices fall by over $1.50, following a last-minute objection from the UAE. Reportedly, the UAE would prefer a higher baseline from which their 2022 production cuts would be calculated (current baseline is 3.2 mb/d while expansion efforts may have increased maximum capacity closer to 4 mb/d).
With crude oil markets currently in deficit and the default for no agreement being a return to the current agreement of no more supply increases, oil then spring boarded higher again to close at $75.21.
Overall, developments today indicated a bullish outcome is likely versus consensus expectations leading into the meeting. However, the market will need to wait until the OPEC meeting reconvenes today at 10.30 am EST to confirm this.
If OPEC and the Joint Ministerial Monitoring Committee fail to make a concrete recommendation there are past examples this year of the group maintaining production discipline and even cutting further.
All of this against the backdrop of EIA and API data that showed US crude stockpiles fell much more than expected last week amid rising summer demand.
After closing above $75.00 for the first time since 2018, the next upside resistance for crude oil is at $76.90 coming from October 208 high. If crude oil was to break above $76.90 in the event of a “no-deal” then allow the rally to extend towards $80 and beyond that the mid $80s where a sequence of lows from 2012 and 2013 will provide resistance.
On the downside, there is short-term support at $72.00 and again at $70.00 before medium-term uptrend support near $68.00 which is my preferred level to look for basing in the event of a higher than expected OPEC production increase.
Source Tradingview. The figures stated areas of the 2nd of July 2021. Past performance is not a reliable indicator of future performance. This report does not contain and is not to be taken as containing any financial product advice or financial product recommendation
Latest market news




Open an account in minutes
Experience award-winning platforms with fast and secure execution, and enjoy tight spreads from 0.5 pts on FX and 0.3 pts on indices.
Economic calendar
Web Trader platform
Our sophisticated web-based platform is packed with features.
Related articles
Euro Short-term Outlook: EUR/USD Selloff Nears Critical Yearly Support 9 23 2026
Euro has fallen seven of the past nine sessions, with stretched momentum raising the stakes as EUR/USD closes in on a major inflection zone.
GBP/USD forecast: US dollar surges as bonds implode
The US dollar continued to press higher deep into the European session, supported by the slump in the bond markets as yields broke out across the curve. Following the recent hawkish Fed rate hike, yield spreads between the US and the rest of the world has continually increased, and that motion continued today, helped in part by some forecast-beating US macro data and hawkish Fed commentary.

Australian Dollar Technical Outlook: AUD/USD Breakdown Threatens Deeper Correction 9 23 2026
AUD/USD remains under pressure after breaking key trend support, with the latest decline putting the focus on the next major downside pivot.
This report is intended for general circulation only. It should not be construed as a recommendation, or an offer (or solicitation of an offer) to buy or sell any financial products. The information provided does not take into account your specific investment objectives, financial situation or particular needs. Before you act on any recommendation that may be contained in this report, independent advice ought to be sought from a financial adviser regarding the suitability of the investment product, taking into account your specific investment objectives, financial situation or particular needs.
StoneX Financial Pte. Ltd., may distribute reports produced by its respective foreign entities or affiliates within the StoneX group of companies or third parties pursuant to an arrangement under Regulation 32C of the Financial Advisers Regulations. Where the report is distributed to a person in Singapore who is not an accredited investor, expert investor or an institutional investor (as defined in the Securities Futures Act), StoneX Financial Pte. Ltd. accepts legal responsibility to such persons for the contents of the report only to the extent required by law. Singapore recipients should contact StoneX Financial Pte. Ltd. at 6826 9988 for matters arising from, or in connection with the report.
In the case of all other recipients of this report, to the extent permitted by applicable laws and regulations neither StoneX Financial Pte. Ltd. nor its associated companies will be responsible or liable for any loss or damage incurred arising out of, or in connection with, any use of the information contained in this report and all such liability is hereby expressly disclaimed. No representation or warranty is made, express or implied, that the content of this report is complete or accurate.
StoneX Financial Pte. Ltd. is not under any obligation to update this report.
Trading CFDs carries a high level of risk that may not be suitable for some investors. Consider your investment objectives, level of experience, financial resources, risk appetite and other relevant circumstances carefully. The possibility exists that you could lose some or all of your investments, including your initial deposits. If in doubt, please seek independent expert advice. Visit www.forex.com/en-sg/terms-and-policies for the complete Risk Disclosure Statement.