



Vodafone H1 preview: Where next for the Vodafone share price?
Vodafone is expected to report higher revenue and earnings in the first half. We explain what to expect and consider how Vodafone shares could react.
Share this:

When will Vodafone release interim earnings?
Vodafone will release first half earnings on the morning of Tuesday November 16.
Vodafone H1 earnings preview: what to expect from the results
Vodafone delivered 3.3% service revenue growth in the first quarter, which came in ahead of the 1.9% pencilled in by analysts. That was thanks to a revival in roaming revenue, which soared over 56% as restrictions eased and people started to travel overseas again, although it remained less than half of pre-pandemic levels. Growth in business service revenue also contributed thanks to strong demand for IoT and digital services.
Service revenue growth is expected to have slowed to 2.2% in the second quarter due to less favourable comparisons from last year, which should equal out to around 5.3% growth for the first half.
Analysts forecast Vodafone’s overall revenue will rise 4.1% to EUR22.31 billion from EUR21.43 billion the year before, signalling slower growth in the second quarter compared to the 5.6% rise reported in the first, and for adjusted Ebitda to climb to EUR7.43 billion from EUR7.02 billion. Adjusted EPS is forecast to grow to 4.40 cents from 4.11 cents.
Vodafone raised its guidance when it released its first quarter update and is pursuing annual adjusted Ebitda of between EUR15.0 billion to EUR15.4 billion and adjusted free cashflow of at least EUR5.2 billion (from its original goal of earnings of EUR14.4-14.6 billion and cashflow of EUR5.0 billion). If delivered, that would improve from the EUR14.9 billion in adjusted Ebitda and adjusted free cashflow of EUR5.0 billion delivered in the last financial year.
Vodafone also outlined its medium-term ambitions for the first time back in May after spending the last three years carrying out its ongoing transformation. Vodafone is aiming to deliver ‘consistent revenue growth’ in Europe and Africa and to keep expanding margins and cashflow to deliver mid-single digit growth in both adjusted Ebitda and free cashflow. It has also said it is aiming to pay a minimum annual dividend of 9.0 cents per share, in-line with what it paid in the last financial year.
Where next for the Vodafone share price?
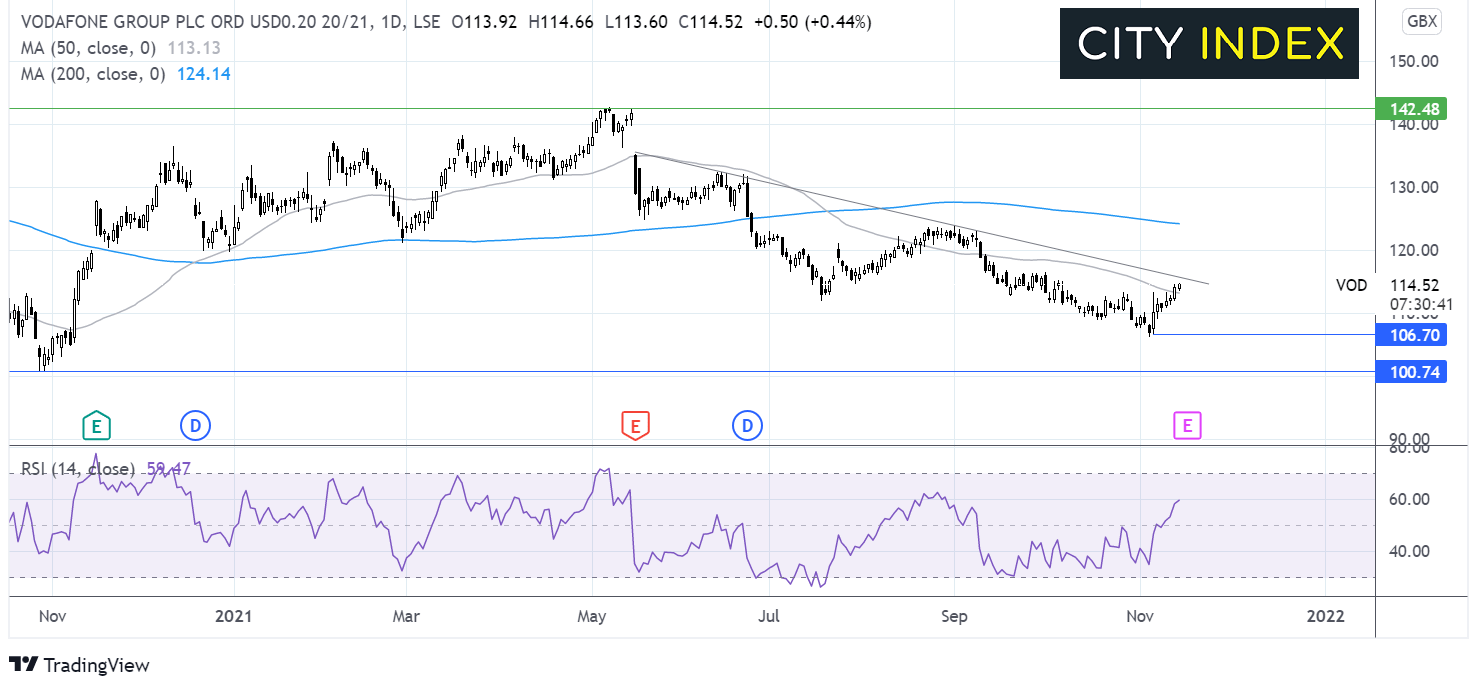
After refreshing the post pandemic high of 142p in May, the Vodafone share price has been trending lower, finding support at 106p the year to date low. The share prices trades below its multi-month falling trendline but more recently the price is extending a rebounded off 106p.
A move above the 50 sma and a bullish RSI point to further upside. Buyers are looking for a move over the falling trend line to expose the 200sma at 124p. It would take a move above here to negate the downtrend and for buyers to gain traction.
Rejection at the falling trendline could see the price fall back towards 106p and 100p, a level last seen in October 2020.

How to trade Vodafone shares
You can trade Vodafone shares with City Index in just four easy steps:
- Open a City Index account, or log-in if you’re already a customer.
- Search for ‘Vodafone’ in our award-winning platform
- Choose your position and size, and your stop and limit levels
- Place the trade
You can trade Vodafone shares with Forex.com in just four steps:
- Open a Forex.com account, or log-in if you’re already a customer.
- Search for ‘Vodafone’ in our award-winning platform
- Choose your position and size, and your stop and limit levels
- Place the trade
Related tags:
Latest market news




Open an account in minutes
Experience award-winning platforms with fast and secure execution, and enjoy tight spreads from 0.5 pts on FX and 0.3 pts on indices.
Economic calendar
Web Trader platform
Our sophisticated web-based platform is packed with features.
Related articles
GBP/USD forecast: US dollar surges as bonds implode
The US dollar continued to press higher deep into the European session, supported by the slump in the bond markets as yields broke out across the curve. Following the recent hawkish Fed rate hike, yield spreads between the US and the rest of the world has continually increased, and that motion continued today, helped in part by some forecast-beating US macro data and hawkish Fed commentary.
Australian Dollar Technical Outlook: AUD/USD Breakdown Threatens Deeper Correction 9 23 2026
AUD/USD remains under pressure after breaking key trend support, with the latest decline putting the focus on the next major downside pivot.

EUR/USD, Nasdaq Price Outlook: Reversal Risks Build
EUR/USD and Nasdaq Price Outlook: Overbought/oversold momentum on hourly and daily time frames is raising reversal risks across the U.S. dollar, EUR/USD and Nasdaq after a strong weekly advance.

This report is intended for general circulation only. It should not be construed as a recommendation, or an offer (or solicitation of an offer) to buy or sell any financial products. The information provided does not take into account your specific investment objectives, financial situation or particular needs. Before you act on any recommendation that may be contained in this report, independent advice ought to be sought from a financial adviser regarding the suitability of the investment product, taking into account your specific investment objectives, financial situation or particular needs.
StoneX Financial Pte. Ltd., may distribute reports produced by its respective foreign entities or affiliates within the StoneX group of companies or third parties pursuant to an arrangement under Regulation 32C of the Financial Advisers Regulations. Where the report is distributed to a person in Singapore who is not an accredited investor, expert investor or an institutional investor (as defined in the Securities Futures Act), StoneX Financial Pte. Ltd. accepts legal responsibility to such persons for the contents of the report only to the extent required by law. Singapore recipients should contact StoneX Financial Pte. Ltd. at 6826 9988 for matters arising from, or in connection with the report.
In the case of all other recipients of this report, to the extent permitted by applicable laws and regulations neither StoneX Financial Pte. Ltd. nor its associated companies will be responsible or liable for any loss or damage incurred arising out of, or in connection with, any use of the information contained in this report and all such liability is hereby expressly disclaimed. No representation or warranty is made, express or implied, that the content of this report is complete or accurate.
StoneX Financial Pte. Ltd. is not under any obligation to update this report.
Trading CFDs carries a high level of risk that may not be suitable for some investors. Consider your investment objectives, level of experience, financial resources, risk appetite and other relevant circumstances carefully. The possibility exists that you could lose some or all of your investments, including your initial deposits. If in doubt, please seek independent expert advice. Visit www.forex.com/en-sg/terms-and-policies for the complete Risk Disclosure Statement.