




WTI Probes 1Year Low at 5000 Time for a Dead Cat Bounce
Oil traders may look at any near-term rally as a “dead cat bounce” and look to re-enter short positions on any bounce toward the $53.00-54.00 area.
Share this:

When it comes to traders’ fears about the spread of coronavirus, actions can speak louder than words (and data). For instance, the Chinese government’s “aggressive” decision to essentially quarantine nearly 50M people and build two new hospitals in record time foreshadowed that the number of infections was likely to get worse before it got better, a dynamic that has played out over the last two weeks.
A similar dynamic is taking place in the oil market today. According to Bloomberg, Chinese demand for oil products has fallen 20% amidst the lockdown; the estimated 3M b/d decline in demand would mark the worst demand shock since the Great Financial Crisis. Meanwhile, a separate Reuters report that OPEC+ is considering a 500k b/d production cut as early as the middle of this month to try to address the steep drop in demand confirms the severity of the issue.
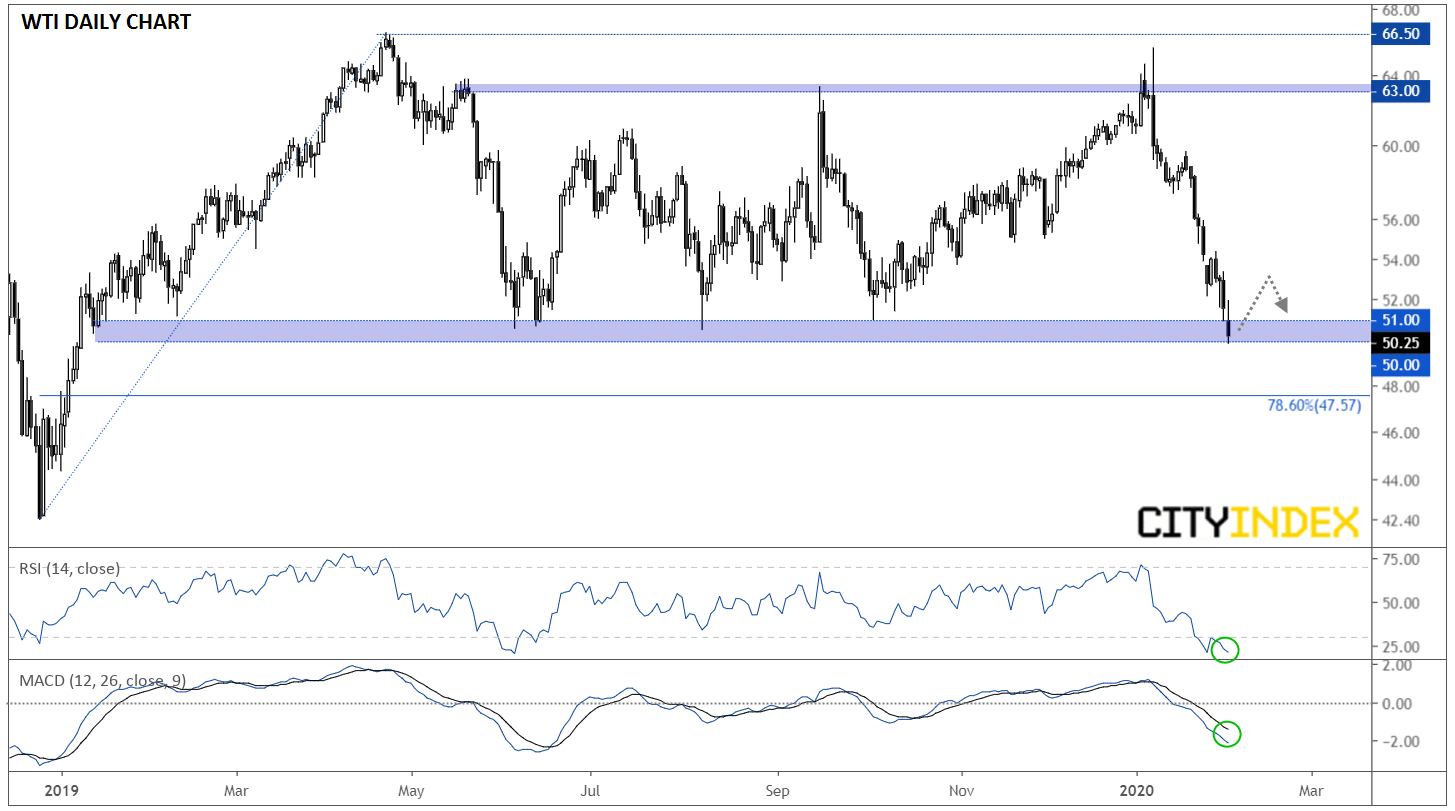
When it comes to oil prices, traders have been selling first and asking questions later. The price of West Texas Intermediate crude oil has collapsed by nearly 25% in less than a month, and despite today’s recovery in other risk assets, WTI continues to probe new lows heading into the close. As the chart below shows, WTI is testing the psychologically-significant $50.00 level, its lowest price in over a year:
Source: TradingView, GAIN Capital.
Over the past 12 months, the $50.00-51.00 corridor has provided support for prices, and with the RSI deeply in oversold territory as of writing, an oversold bounce from these levels cannot be ruled out. That said, until authorities can provably contain the spread of coronavirus, oil traders may look at any near-term rally as a “dead cat bounce” and look to re-enter short positions on any bounce toward the $53.00-54.00 area. Meanwhile, if oil is able to close below $50.00, the next logical level of support would be the 78.6% Fibonacci retracement of the H1 2019 rally near 47.50.
When it comes to traders’ fears about the spread of coronavirus, actions can speak louder than words (and data). For instance, the Chinese government’s “aggressive” decision to essentially quarantine nearly 50M people and build two new hospitals in record time foreshadowed that the number of infections was likely to get worse before it got better, a dynamic that has played out over the last two weeks.
A similar dynamic is taking place in the oil market today. According to Bloomberg, Chinese demand for oil products has fallen 20% amidst the lockdown; the estimated 3M b/d decline in demand would mark the worst demand shock since the Great Financial Crisis. Meanwhile, a separate Reuters report that OPEC+ is considering a 500k b/d production cut as early as the middle of this month to try to address the steep drop in demand confirms the severity of the issue.
When it comes to oil prices, traders have been selling first and asking questions later. The price of West Texas Intermediate crude oil has collapsed by nearly 25% in less than a month, and despite today’s recovery in other risk assets, WTI continues to probe new lows heading into the close. As the chart below shows, WTI is testing the psychologically-significant $50.00 level, its lowest price in over a year:
Source: TradingView, GAIN Capital.
Over the past 12 months, the $50.00-51.00 corridor has provided support for prices, and with the RSI deeply in oversold territory as of writing, an oversold bounce from these levels cannot be ruled out. That said, until authorities can provably contain the spread of coronavirus, oil traders may look at any near-term rally as a “dead cat bounce” and look to re-enter short positions on any bounce toward the $53.00-54.00 area. Meanwhile, if oil is able to close below $50.00, the next logical level of support would be the 78.6% Fibonacci retracement of the H1 2019 rally near 47.50.
Related tags:
Latest market news




Open an account in minutes
Experience award-winning platforms with fast and secure execution, and enjoy tight spreads from 0.5 pts on FX and 0.3 pts on indices.
Economic calendar
Web Trader platform
Our sophisticated web-based platform is packed with features.
Related articles
This report is intended for general circulation only. It should not be construed as a recommendation, or an offer (or solicitation of an offer) to buy or sell any financial products. The information provided does not take into account your specific investment objectives, financial situation or particular needs. Before you act on any recommendation that may be contained in this report, independent advice ought to be sought from a financial adviser regarding the suitability of the investment product, taking into account your specific investment objectives, financial situation or particular needs.
StoneX Financial Pte. Ltd., may distribute reports produced by its respective foreign entities or affiliates within the StoneX group of companies or third parties pursuant to an arrangement under Regulation 32C of the Financial Advisers Regulations. Where the report is distributed to a person in Singapore who is not an accredited investor, expert investor or an institutional investor (as defined in the Securities Futures Act), StoneX Financial Pte. Ltd. accepts legal responsibility to such persons for the contents of the report only to the extent required by law. Singapore recipients should contact StoneX Financial Pte. Ltd. at 6826 9988 for matters arising from, or in connection with the report.
In the case of all other recipients of this report, to the extent permitted by applicable laws and regulations neither StoneX Financial Pte. Ltd. nor its associated companies will be responsible or liable for any loss or damage incurred arising out of, or in connection with, any use of the information contained in this report and all such liability is hereby expressly disclaimed. No representation or warranty is made, express or implied, that the content of this report is complete or accurate.
StoneX Financial Pte. Ltd. is not under any obligation to update this report.
Trading CFDs carries a high level of risk that may not be suitable for some investors. Consider your investment objectives, level of experience, financial resources, risk appetite and other relevant circumstances carefully. The possibility exists that you could lose some or all of your investments, including your initial deposits. If in doubt, please seek independent expert advice. Visit www.forex.com/en-sg/terms-and-policies for the complete Risk Disclosure Statement.