




Oil At 13 Month Low More Downside To Come
Oil heading to $46.70?
Share this:

Aggressive selling continues in oil as fears deepen that the rapid spread of coronavirus will lead to a global pandemic and potentially to a global recession.
Coronavirus
US Crude oil is trending lower for its fourth straight session with few signs that the bulls will take back control anytime soon. The global demand picture is weakening by the day as coronavirus spreads across the globe.
Whilst traders had been pricing in reduced demand from China in the last two weeks of January, comments from US Federal health authorities have added to anxieties. The US CDC warning over the expected spread of coronavirus in the US has meant that reduced demand from the largest oil consumer in the world is now also starting to be priced in.
API data
API reported a smaller than forecast inventory build of 1.3 million barrels, versus expectations of a 3-million-barrel increase. Today’s EIA weekly inventories report is expected to show a build of 2.3 million barrels.
As coronavirus panic takes over, traders are become increasing more concerned with how global oil demand will be hit and less interested in weekly inventory data. There seems to be little interest in the steep decline in Libyan output or whether the OPEC+ group decides to trim production again.
OPEC
It is doubtful that OPEC+ will announce further output cuts right now, without having further information on loss of demand. There is a good chance that they will wait for fresh economic data to assess the impact of coronavirus first. Even if OPEC did announce additional production cuts, we are more likely to see some short covering now rather than a change of trend.
Levels to watch
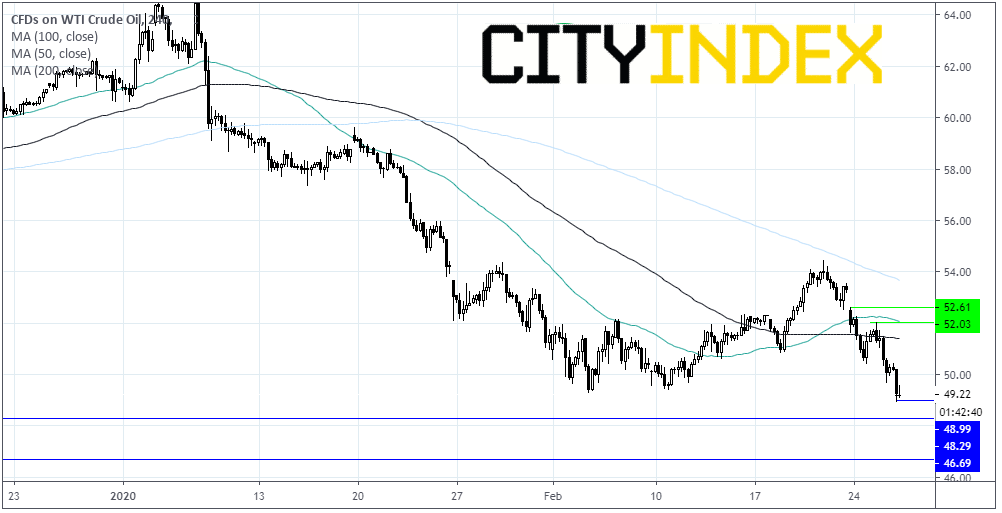
Crude is down 1.7% today and almost 8% so far this week. Crude trades at a 13-month low and below its 50, 100 and 200 moving average, with a bearish outlook.
Immediate support can be seen at $49 (today’s low), a break through here could open the door to $48.30 (8th Jan ‘19 low) prior to $46.70 (4th Jan’19 low).
Resistance csan be seen at $50.42 (today’s high). This could lead towards resistance at $52. (yesterday’s high), a breakthrough there could negate the current bearish trend.
Aggressive selling continues in oil, as fears deepen that the rapid spread of coronavirus will lead to a global pandemic and potentially to a global recession.
Coronavirus
US Crude oil is trending lower for it fourth straight session with few signs that the bulls will take back control anytime soon. The global demand picture is weakening by the day as coronavirus spreads across the globe.
Whilst traders had been pricing in reduced demand from China since the outbreak hit headlines in mid January, comments from US Federal health authorities have added to anxieties. The US CDC warning over the expected spread of coronavirus in the US has meant that reduced demand from the largest oil consumer in the world is now also starting to be priced in.
API data
API reported a smaller than forecast inventory build of 1.3 million barrels, versus expectations of a 3-million-barrel increase. Today’s EIA weekly inventories report is expected to show a build of 2.3 million barrels.
As coronavirus panic takes over, traders are become increasing more concerned with how global oil demand will be hit and less interested in weekly inventory data. There seems to be little interest in the steep decline in Libyan output or whether the OPEC+ group decides to trim production again.
OPEC
It is doubtful that OPEC+ will announce further output cuts right now, without having further information on loss of demand. There is a good chance that they will wait for fresh economic data to assess the impact of coronavirus first. Even if OPEC did announce additional production cuts, we are more likely to see some short covering now rather than a change of trend.
Levels to watch
Crude is down 1.7% today and almost 8% so far this week. Crude trades at a 13-month low and below its 50, 100 and 200 moving average, with a bearish outlook.
Immediate support can be seen at $49 (today’s low), a break through here could open the door to $48.30 (8th Jan ‘19 low) prior to $46.70 (4th Jan’19 low).
Resistance csan be seen at $50.42 (today’s high). This could lead towards resistance at $52. (yesterday’s high), a breakthrough there could negate the current bearish trend.


The complete CFD trading experience
Award-winning platforms, competitive spreads, low commissions and dedicated support.
We live and breathe the markets and are dedicated to helping traders realise their ambitions as we continue to set the industry bar.
Economic calendar
Web Trader platform
Our sophisticated web-based platform is packed with features.
Related articles
Crude Oil Q4 2026 Outlook: Will a New Energy-Security Regime Emerge?
Crude Oil Q4 2026 Outlook: The U.S.-Iran conflict has done more than disrupt oil flows. It has challenged many of the assumptions underpinning the global energy security system established after the 1973 oil embargo.

Oil, Gold Forecast: Two trades to watch 280926
Oil Rises as U.S.-Iran Peace Hopes Fade. Gold Breaks Down on Hawkish Fed Expectations as Treasury Yields and USD Rise.

WTI crude squeezed between Hormuz risk and diesel ban speculation
WTI is being pulled in opposite directions as Hormuz risk collides with growing political pressure over US diesel prices.

StoneX Europe Ltd may make third party material available on this website which may contain information included but not limited to the conditions of financial markets. The material is for information purposes only and does not contain, and should not be construed as containing, investment advice and/or investment recommendation and/or an investment research and/or an offer of or solicitation for any transactions in financial instruments; any decision to enter into a specific transaction shall be made by the client following an assessment by him/her of their situation.
StoneX Europe Ltd makes no representation or warranty and assumes no liability as to the accuracy or completeness of the information provided, nor any loss arising from any investment based on a recommendation, forecast or other information supplied. You should always seek independent advice as to your suitability to speculate in any related markets and your ability to assume the associated risks, if you are at all unsure. We are not under any obligation to update any such material. Any opinion made may be personal to the author and may not reflect the opinion of StoneX Europe Ltd.