



ASX 200 Market Outlook: FMG Eyes Breakout, WOW Firms Up
ASX 200 rises for a third day as miners lead the charge. FMG eyes a breakout, WOW firms up, and Industrials hit a 16-week high.
Share this:

The ASX 200 extended its rebound for a third straight session, shrugging off hotter-than-expected CPI and instead following Wall Street’s lead. The index has now held above both its 200-day SMA and EMA for a second day, though overhead resistance from the June high and September low is tightening the near-term range. Miners and defensives supported the advance, with Industrials pushing to a 16-week high.
View related analysis:
View related analysis:
ASX 200 Outlook: Industrials Strength and Miner Momentum
ASX 200 Market Snapshot
- The Australian share market rose for a third straight day despite a hot CPI print, taking its lead from the rebound on Wall Street.
- The ASX 200 has now closed above its 200-day SMA for a second session and marginally above its 200-day EMA today.
- However, resistance emerged around the June high at 8615.2, with the September low at 8731 also nearby as a potential barrier.
- Eight of the eleven ASX sectors advanced, led by Materials (XMJ), Health Care (XHJ) and Consumer Discretionary (XDJ), while Technology (XIJ) and Communication Services (XTJ) were among the three sectors that finished lower.
- The Industrials index (XNJ) climbed to a 16-week high.
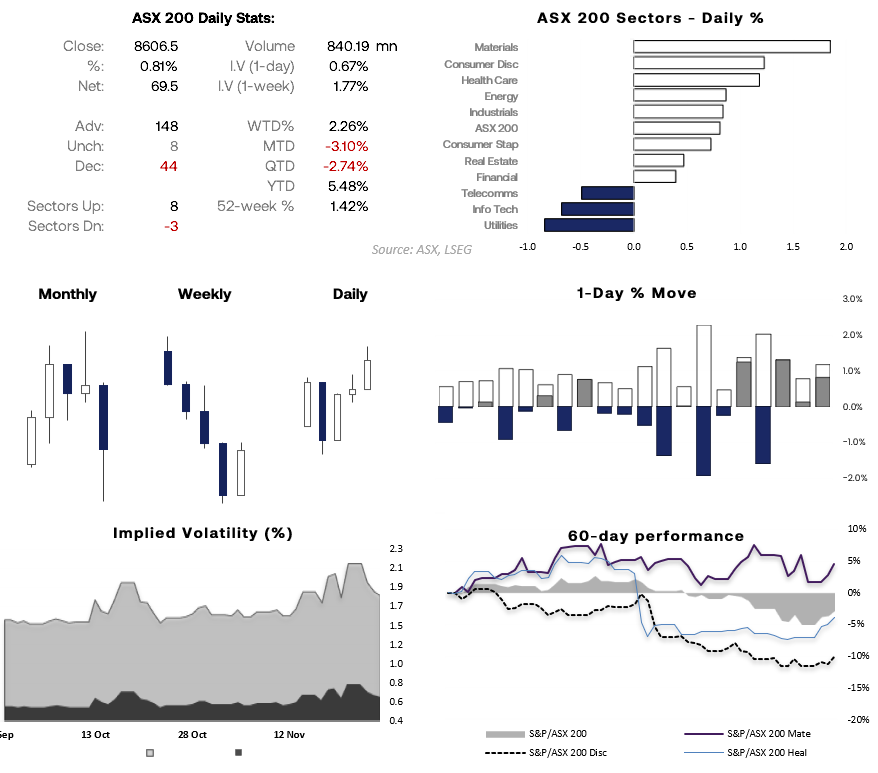
Chart analysis by Matt Simpson - source: ASX, LSEG


Woolworths (WOW) Technical Analysis:
I first highlighted the potential for Woolworths (WOW) to rally from oversold levels on 22 October, off a bullish engulfing week above the March 2020 low and a small bull flag on the daily chart. Since then, WOW has reached the 28 target near the September high and moved into a multi-week consolidation. Recent price action now hints at a possible next leg higher.
The daily chart shows WOW has repeatedly respected the gap-support zone after completing a potential three-wave pullback within its range. A triple bottom formed within a bull flat, alongside a rickshaw man doji on Tuesday, before prices gapped higher today.
My bias stays bullish while WOW holds above the recent swing lows, with scope for at least a move towards 29. A break above that level brings the gap-resistance high at 29.80 into view for bulls.
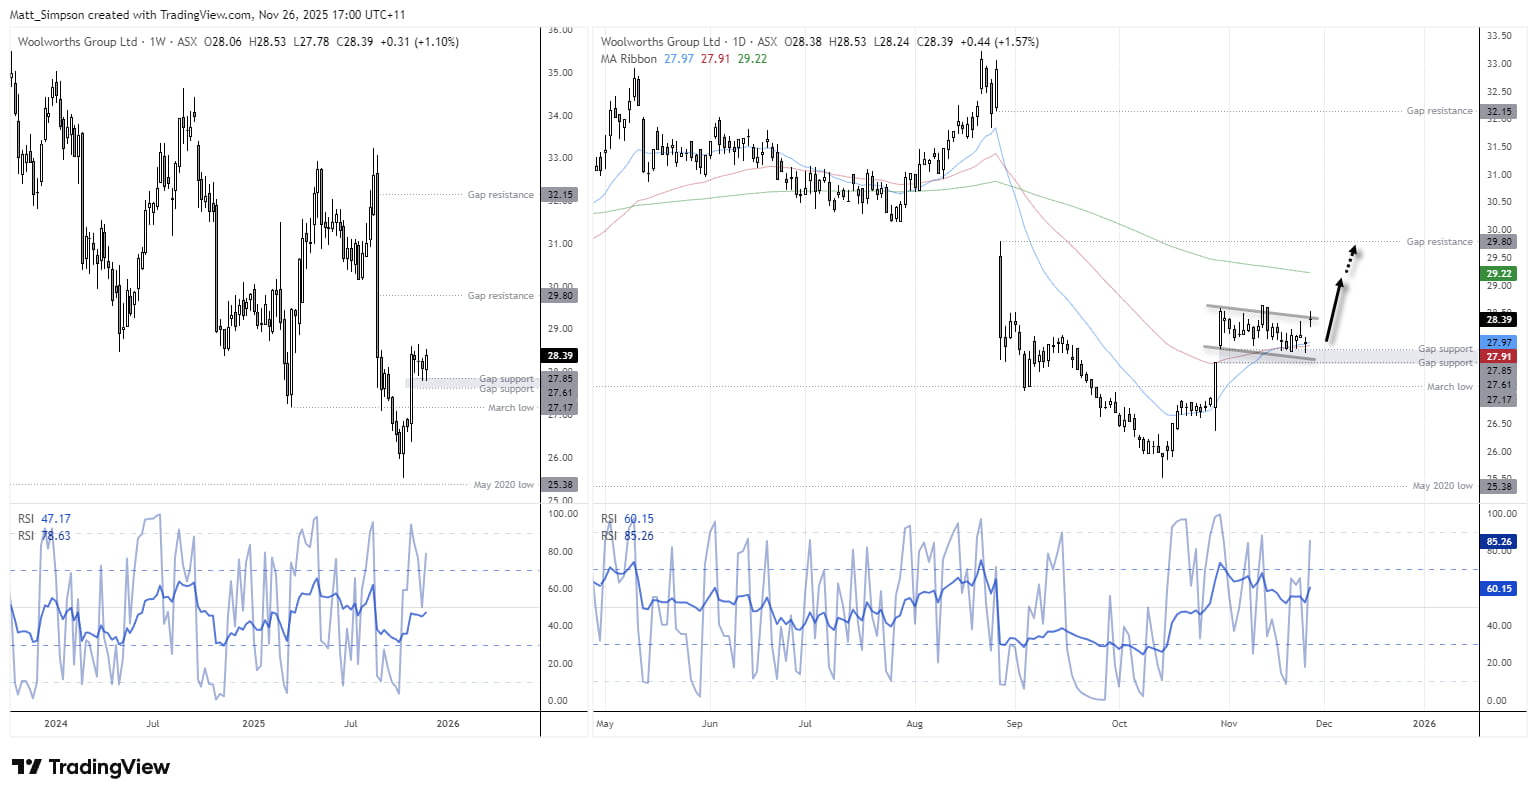
Chart analysis by Matt Simpson - Source: ASX, TradingView


Fortescue (FMG) Technical Analysis
I renewed my bullish bias on Fortescue last week, and FMG is now on the brink of a potential breakout. It exceeded an earlier bullish target at the end of October before a shallow pullback, but momentum has returned and the stock is now eyeing a move above 21.50.
FMG led the mega-cap miners on Wednesday, rising 2.4% on above-average volume. BHP Group (BHP) climbed just under 2%, Rio Tinto (RIO) gained 1.9%, and Northern Star Resources (NST) added 1.8%.
BHP has now risen 4% from its 200-day EMA and looks set to challenge the 43.45 high. RIO is also worth watching for a breakout above 135.24. While NST sits near cycle highs, its price action remains messy and lacks the cleaner bullish signals I typically look for during breakout setups.

Chart analysis by Matt Simpson - Source: ASX, TradingView
View the full economic calendar
View the full economic calendar
-- Written by Matt Simpson
Follow Matt on Twitter @cLeverEdge
How to trade with City Index
You can trade with City Index by following these four easy steps:
- Open an account, or log in if you’re already a customer
• Open an account in the UK
• Open an account in Australia
• Open an account in Singapore
- Search for the market you want to trade in our award-winning platform
- Choose your position and size, and your stop and limit levels
- Place the trade
Related tags:



Open an account today
Experience award-winning platforms with fast and secure execution.
Economic calendar
Web Trader platform
Our sophisticated web-based platform is packed with features.
Related articles

Nasdaq 100 Forecast: Anthropic Weighs on NDX Sentiment
As November approaches its end, weakening confidence around major equity benchmarks such as the Nasdaq 100 remains an important theme in financial markets. The index continues to face significant short-term weakness and, over the last two trading sessions alone, has fallen nearly 6.0%, highlighting a bearish bias that has not been this evident for several months.


silver-crash-2026-vs-2011-collapse
Silver has collapsed some 65% from its January peak, drawing uncomfortable comparisons with the 2011 crash. The parallels are striking, but a bigger bubble, a hawkish Federal Reserve and years of supply deficits make this episode different.


Nasdaq 100, SOX: Tech rout may be a symptom of something far larger
The financial tide is going out, and some of the market's biggest winners are being hammered. Our research suggests there's more to the tech rout than the AI headlines.

From time to time, StoneX Financial Pty Ltd (“we”, “our”) website may contain links to other sites and/or resources provided by third parties. These links and/or resources are provided for your information only and we have no control over the contents of those materials, and in no way endorse their content. Any analysis, opinion, commentary or research-based material on our website is for information and educational purposes only and is not, in any circumstances, intended to be an offer, recommendation or solicitation to buy or sell. You should always seek independent advice as to your suitability to speculate in any related markets and your ability to assume the associated risks, if you are at all unsure. No representation or warranty is made, express or implied, that the materials on our website are complete or accurate. We are not under any obligation to update any such material.
As such, we (and/or our associated companies) will not be responsible or liable for any loss or damage incurred by you or any third party arising out of, or in connection with, any use of the information on our website (other than with regards to any duty or liability that we are unable to limit or exclude by law or under the applicable regulatory system) and any such liability is hereby expressly disclaimed.