

Advanced charts
Get total control
Trade from charts
Create new orders directly from the charts and click and drag to edit existing orders.
Over 80 technical indicators
From Bollinger Bands to MACD to Parabolic SAR, use a wealth of customisable indicators that can be saved to match your trading style.

Identify trends
14 time intervals
Identify trading patterns using chart time intervals ranging from 1-minute through to daily or monthly time frames. Quickly zero in on a chart area of interest using the ‘zoom region’ feature.
Multiple chart types
Choose from a variety of chart styles, customise what information you see, and the look of the trend lines.
Compare markets
Add multiple markets to a single chart to analyse performance and spot new trades at a glance.

Choose your chart type
Extensive drawing tools
Plan your next trade with customisable charting and drawing tools that come with handy ‘undo’ and ‘redo’ buttons.
Customisable features
Tailor everything from the indicators and visibility options and save it as a template.

Frequently asked questions
What are technical indicators and how do I use them
Technical indicators are tools you can apply to a market’s chart that give you extra insight into its price action. They usually involve applying extra calculations to a period of price action, then displaying that on a chart.
A moving average, for example, averages out a market’s closing prices over a set number of periods and shows the resulting figures as a line. Viewing a moving average helps to cut out the noise of smaller price movements, giving you a market’s broad trajectory – and can be useful when looking for areas of support or resistance.
Your FOREX.com account comes with 80+ indicators, including moving averages, Bollinger Bands, the Relative Strength Index and more. You can test them all out in a risk-free environment with a free FOREX.com demo account, or learn more about how indicators work in the Academy.
What are trading charts?
Trading charts are tools you can use to quickly and easily analyse the price action of a given market. They tell you the market’s current price, as well as how it got there – which is crucial in determining trends, areas of support and resistance and more.
Technical traders rely entirely on charts when looking for new opportunities. They watch for patterns – which they believe can predict future price action – and apply indicators to get further insight into where a market might be headed next.
To learn more about how to use charts in your trading, head over to the FOREX.com Academy.
How do you read trading charts?
A trading chart has two axes: the horizontal x axis, which indicates time, and the vertical y axis which indicates price. So at a glance, you can see a market’s price history for the duration of the chart. However, there are different types of chart that display this price history in different ways.
Each will break down trading activity into individual periods – which could be as short as a minute, or as long as month. The simplest chart type, a line chart, will tell you the market’s price at the close of each of these periods. You’ll get a broad idea of movement, but you won’t know what happened within a specific period.
The most popular type of chart is a candlestick chart, which uses ‘candlesticks’ to tell you the market’s high, low, open and closing prices within the period.
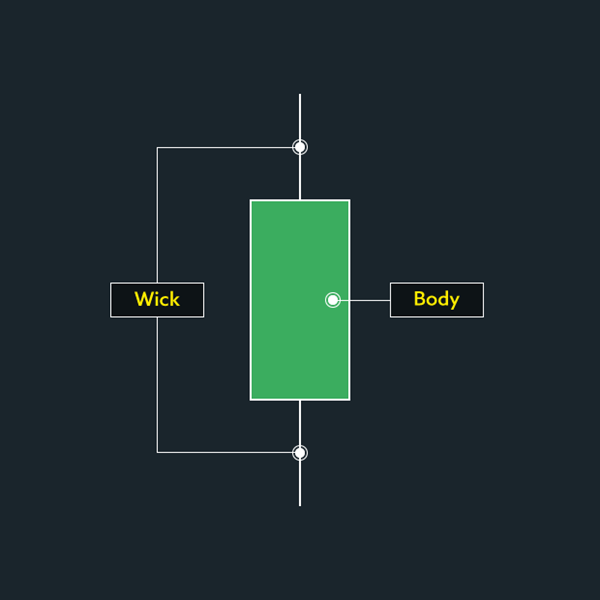
A candlestick has two parts. The first is a solid body that’s either red (if the market fell during the period) or green (if it rose) – this tells you the period’s open and close prices. The second is a thin line coming out of the top and bottom of the body. This is called the wick, and tells you the market’s highest and lowest points in the period.
Learn more about how to read charts.
If you have more questions visit the FAQ section or start a chat with our support.