



ASX 200 Morning Outlook: Buyers Test Support as BHP and WOW Stabilise
ASX 200 steadies after two days of losses as BHP and Woolworths find support, hinting that buyers may be testing the waters.
Share this:

The ASX 200 extended its losing streak to a second day but showed early signs of stabilisation, outperforming its APAC peers after the Nikkei 225 plunged as much as 3%. Technical signals point to a potential rebound, with BHP and Woolworths finding support and showing signs of renewed buyer interest.
View related analysis:
- Nasdaq 100 Outlook: Tech Bulls Rattled as Wall Street Selloff Deepens
- ASX 200 Morning Market Outlook: Sectors Highlight Structural Weakness
- ASX 200 Morning Market Outlook: Westpac (WBC) Leads Big 4 Lower Post-CPI
- ASX 200 Morning Outlook: Real Estate Reeling Post RBA (GMG, GPT, SCG)
- ASX 200 Morning Market Outlook: Bearish Reversal Pattern For October
View related analysis:
- Nasdaq 100 Outlook: Tech Bulls Rattled as Wall Street Selloff Deepens
- ASX 200 Morning Market Outlook: Sectors Highlight Structural Weakness
- ASX 200 Morning Market Outlook: Westpac (WBC) Leads Big 4 Lower Post-CPI
- ASX 200 Morning Outlook: Real Estate Reeling Post RBA (GMG, GPT, SCG)
- ASX 200 Morning Market Outlook: Bearish Reversal Pattern For October
ASX 200 Outlook: Buyers Step In as Sentiment Stabilises
ASX 200 Market Snapshot
- The ASX 200 closed lower for a second consecutive day but outperformed its APAC peers, including the Nikkei 225, which fell as much as 3% on Wednesday.
- Seven of the eleven ASX sectors declined, led by Information Technology (XIJ) and Materials (XMJ).
- A bullish hammer formed at the September low, while daily trading volume rose to a four-day high, suggesting a potential shift in momentum from bears to bulls.
- Thursday has historically been the most volatile day of the week for the ASX 200, with an average daily range of 78.8 points over the past year — though this has eased to 73.2 points over the past three months.
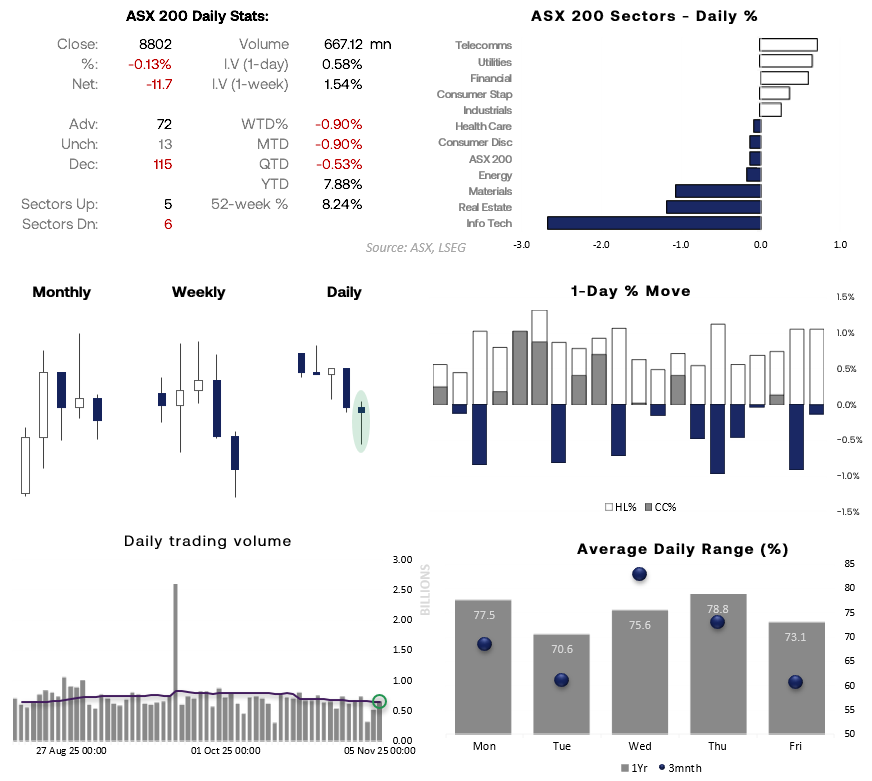
Chart analysis by Matt Simpson - source: ASX, LSEG


BHP Group (BHP) Technical Analysis
While the BHP share price has risen 36% from its April low to October high, it has entered a pullback after meeting resistance around the September 2024 high. The depth of the retracement remains unclear, although it’s worth noting that BHP posted three consecutive bearish weeks during its previous correction in August.
If BHP closes the week around current levels, it will have completed a three-bar bearish reversal (evening star pattern), with the second candle forming a shooting star. That said, recent price action on the daily chart suggests near-term support has emerged, hinting at the potential for at least a short-term bounce.
Wednesday’s bullish gravestone doji closed back above the 50-day EMA and the weekly pivot point. Its low perfectly respected the October VPOC, with the September VPOC nearby. The daily RSI (2) also shows its most oversold reading since August.
Bulls could look to buy dips within Wednesday’s range and maintain a near-term bullish bias while prices hold above the September VPOC (41.72). An open target may be suitable in anticipation of a possible bullish catalyst.
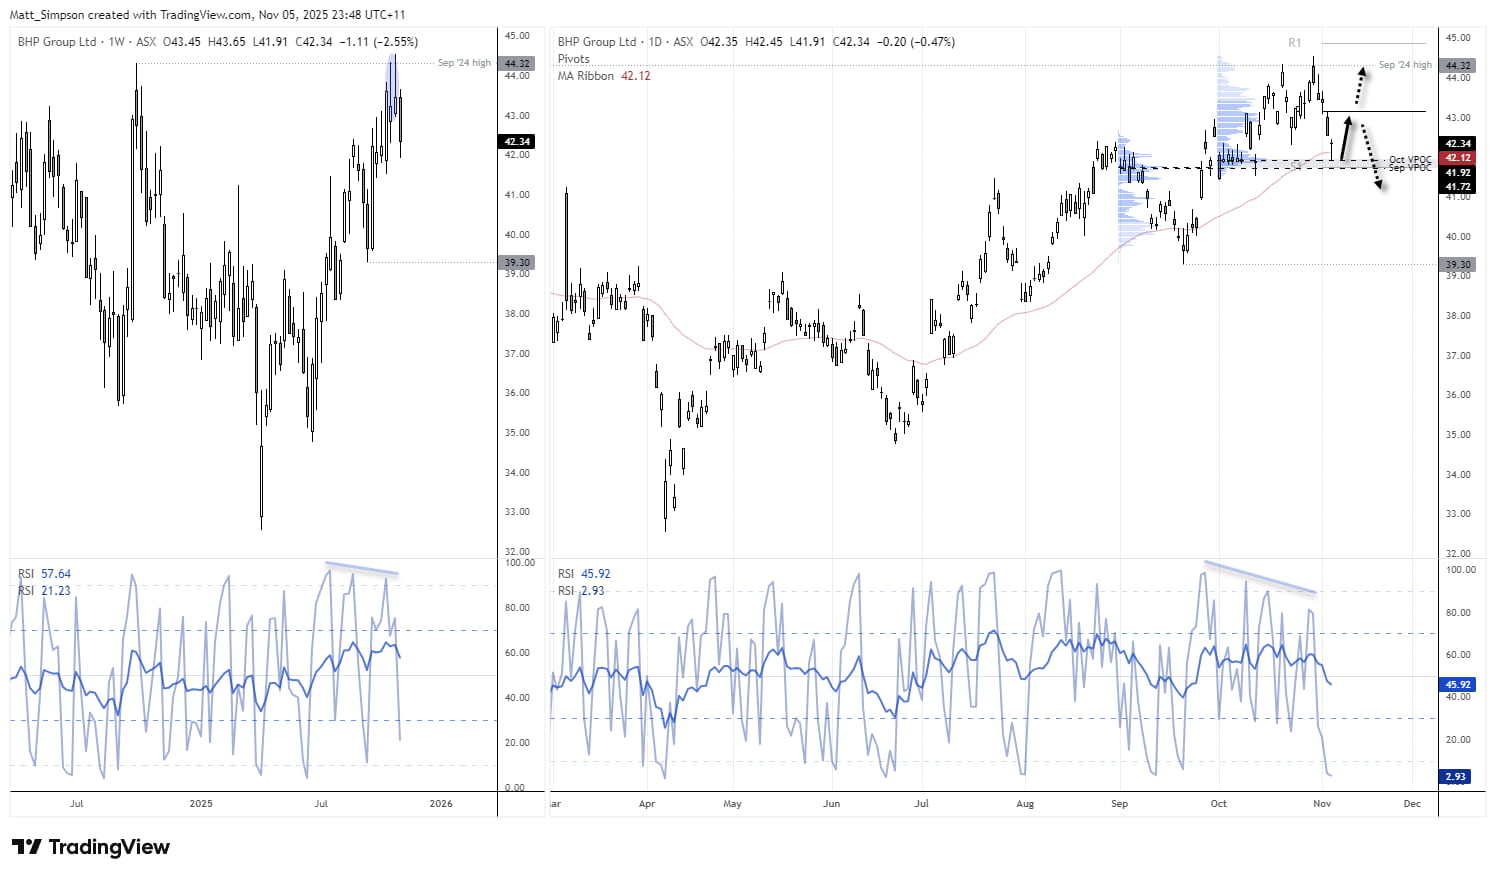
Chart analysis by Matt Simpson - source: ASX, TradingView
Woolworths (WOW) Technical Analysis
Last week, Woolworths (WOW) posted a solid two-day rally exceeding 8%, aligning with my prior bullish bias. The gap above the 50-day EMA during that surge highlights a strong burst of buying enthusiasm.
Prices are now retracing gently lower, and with the gap, 50-day EMA (27.71), and monthly pivot point (27.50) clustered nearby, these levels could offer potential support. Bulls may be waiting to reload, targeting the monthly R1 (29.50) or gap resistance near the $30 handle.
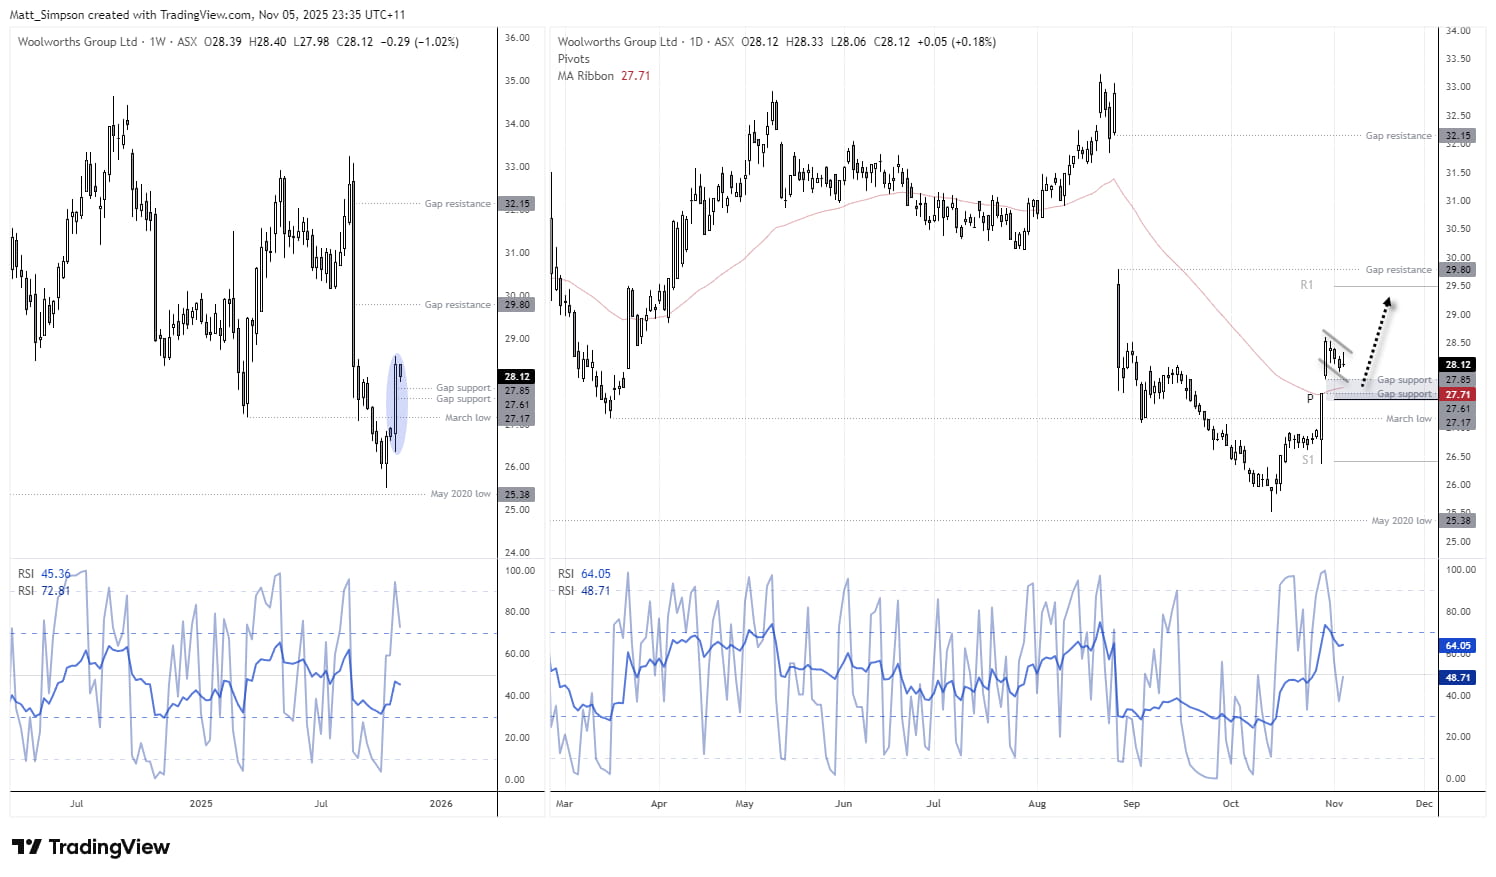
Chart analysis by Matt Simpson - source: ASX, TradingView
ASX 200 Watchlist Update
Goodman Group (GMG) broke beneath its September low in line with my bearish bias. The ASX Real Estate (XRE) sector has remained under pressure since the RBA’s dovish hold on Tuesday, with the index now trading below 4000 — marking a four-month low.
GPT Group (GPT) gapped lower beneath the September low but reversed its losses and fully closed the gap by the session’s end, signalling the potential for a false move. It’s touch-and-go from here as to whether that was a bear trap or the early stages of a renewed bearish leg.
Commonwealth Bank (CBA) reached my upside target at the August high, though the spinning top doji and choppy price action suggest the rally is losing momentum. Still, if prices can hold above the 169.16 low, a push towards 180 remains on the cards.


ASX 200, SPI 200 Futures Technical Analysis
The daily cash chart of the ASX 200 shows that Wednesday’s bullish hammer formed around the September low and closed back above the 100-day EMA after briefly breaking beneath it intraday. A small bullish RSI (2) divergence has also appeared within the oversold zone, hinting at possible short-term upside momentum.
On the ASX 200 futures chart (SPI 200) to the right, a spinning top doji has developed near the 100-day EMA and 8756 low. The overnight rebound in Wall Street futures lifted SPI 200 futures alongside it. My near-term bias remains bullish, with buyers likely to seek dips towards the 100-day EMA or 8800 handle, targeting 8950, 9000, and the 9093 HVN as potential upside objectives.

Chart analysis by Matt Simpson - Source: TradingView, ASX SPI 200 Index Futures, S&P/ASX 200 Index
View the full economic calendar
View the full economic calendar
-- Written by Matt Simpson
Follow Matt on Twitter @cLeverEdge
How to trade with City Index
You can trade with City Index by following these four easy steps:
- Open an account, or log in if you’re already a customer
• Open an account in the UK
• Open an account in Australia
• Open an account in Singapore
- Search for the market you want to trade in our award-winning platform
- Choose your position and size, and your stop and limit levels
- Place the trade




Open an account today
Experience award-winning platforms with fast and secure execution.
Economic calendar
Web Trader platform
Our sophisticated web-based platform is packed with features.
Related articles

ASX 200 On Track for Worst Week in Four Years, Raising Bear Market Fears
The ASX 200 faces its worst week in four years as falling commodities, China's economic weakness and broad-based selling threaten a deeper correction.

S&P 500 Analysis: SPX Is Going Through One of Its Most Difficult Periods of 2026
Confidence around the U.S. equity market continues to face significant pressure. Over the last three trading sessions alone, the S&P 500 has fallen nearly 3.3%, highlighting a bearish bias that has become increasingly evident across the broader market.

Nasdaq 100 forecast: Markets turn jittery as Anthropic debuts at 34% above IPO
Nasdaq futures were up some 2% earlier, but shortly after the Anthropic debut, the index slumped to session lows, down more than 1.5%, before bouncing back from the lows at the time of writing. Much of the selling for the Nasdaq was driven by AMD which slumped nearly 10% after a Hunterbrook Media report raised fresh questions about the company’s exposure to US export controls on China.

From time to time, StoneX Financial Pty Ltd (“we”, “our”) website may contain links to other sites and/or resources provided by third parties. These links and/or resources are provided for your information only and we have no control over the contents of those materials, and in no way endorse their content. Any analysis, opinion, commentary or research-based material on our website is for information and educational purposes only and is not, in any circumstances, intended to be an offer, recommendation or solicitation to buy or sell. You should always seek independent advice as to your suitability to speculate in any related markets and your ability to assume the associated risks, if you are at all unsure. No representation or warranty is made, express or implied, that the materials on our website are complete or accurate. We are not under any obligation to update any such material.
As such, we (and/or our associated companies) will not be responsible or liable for any loss or damage incurred by you or any third party arising out of, or in connection with, any use of the information on our website (other than with regards to any duty or liability that we are unable to limit or exclude by law or under the applicable regulatory system) and any such liability is hereby expressly disclaimed.