



ASX 200 Tests Range Highs as RBA Rate Hike Odds Collapse
Hopes for a US-Iran peace deal may have sparked today's rally, but softer RBA pricing could be helping to keep it alive. Is the stage being set for a push towards 8900?
Share this:

- RBA August hike odds tumble to 28%
- ASX 200 presses against 8811
- Bulls retain the near-term advantage
Rates Tailwind Re-Emerges
One of the more interesting developments in Australian equities over the past month has been the building positive relationship with movements in Australian three-year government bond futures, which are highly sensitive to shifts in expectations for the RBA cash rate outlook.
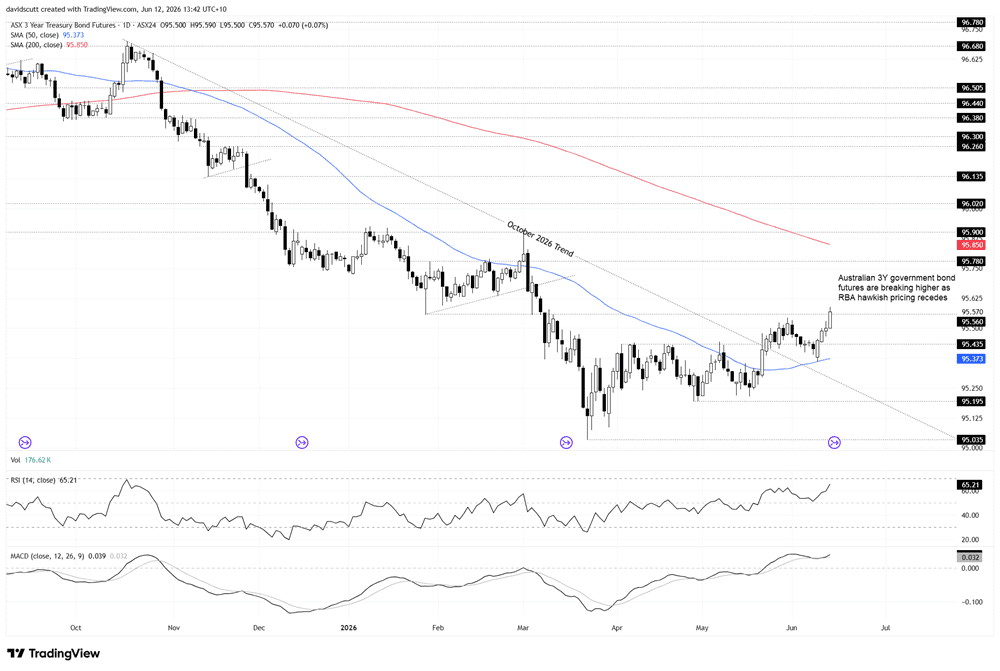
Source: TradingView
Having been priced at over 80% during periods last month, the probability of a 25 basis point RBA hike in August, seen as the next realistic opportunity with next week's meeting viewed as a placeholder by traders, is now down to just 28%. Earlier this week, it was still priced above 50%.
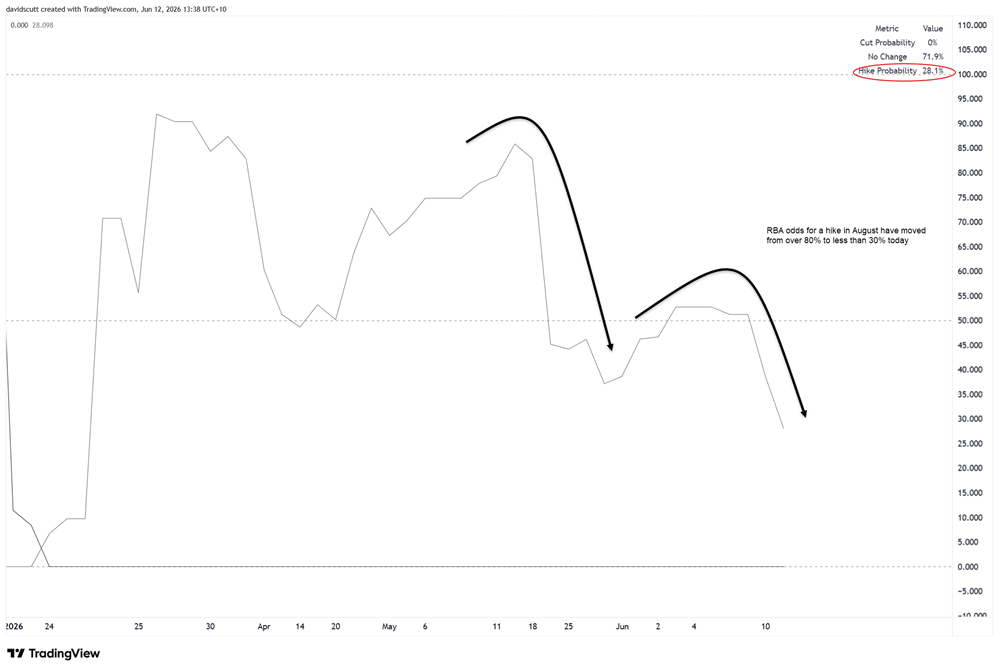
Source: TradingView
Purely from a valuation perspective, the prospect of the cash rate peaking at a lower level, or having already peaked, may help improve domestic economic sentiment and drive PE expansions. While there's little doubt today's surge has been largely driven by hopes for an actual firm peace deal between the US and Iran, declining hawkish RBA pricing may also be helping at the margin.
The Technical Picture
Source: TradingView
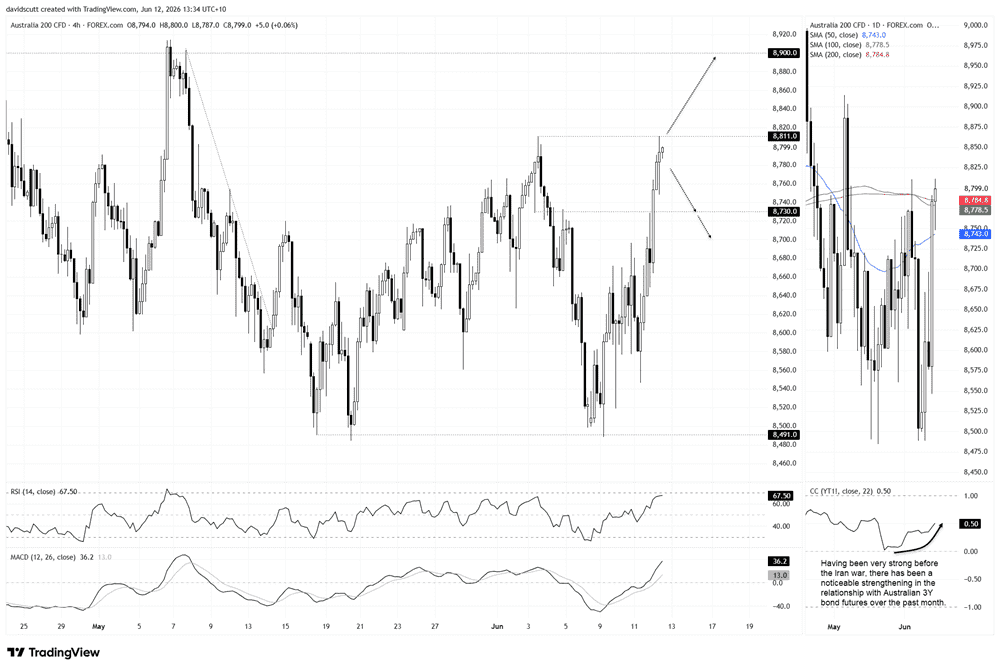
Our ASX 200 contract is testing the recent range highs at 8811 on the H4 timeframe, with the initial probe ending in failure. However, the price continues to sit above the 100 and 200-day moving averages on the daily chart on the right, a zone that it's struggled to hold above in the recent past. As such, given where the contract now trades, we have some levels to build trade setups around.
If the price can push above the current range high of 8811 and hold there, longs could be set targeting 8900, a level that's acted as both support and resistance during periods this year. A stop beneath 8811 would offer protection against reversal. Right now, the message from RSI (14) and MACD on the H4 favours longs over shorts, with upside momentum continuing to build.
However, given the initial reluctance to break the range, and history around these levels, shorts cannot be discounted entirely. Should the price reverse and close beneath the lower end of the moving average zone at 8778.5, shorts could be considered with a stop above the upper end of the zone at 8784.8, targeting 8730 or 8700 initially. 8547 looms as another target, marking the low hit on Thursday prior to the latest bout of Iran-US peace deal hopes.
Latest market news




Open an account today
Experience award-winning platforms with fast and secure execution.
Economic calendar
Web Trader platform
Our sophisticated web-based platform is packed with features.
Related articles
Euro Short-term Outlook: EUR/USD Plunges to 19-Month Low—Bears Face Critical Test 11 18 2026
The Euro selloff is now approaching pivotal support, raising the prospect of downside exhaustion as the November decline extends.

Copper forecast: risk-off mood and demand worries sink prices below $6
Copper has broken below $6, its 200-day moving average and a trend line dating back to August 2025. With industrial metals under pressure and the dollar firm, $5.50 is now the level to watch.


Japanese Yen Technical Outlook: USD/JPY Rally Stalls Near 160—Breakout Support in Focus 11 18 2026
USD/JPY has set its weekly range just above former resistance, with a range break likely to determine whether November’s rally has further to run.
From time to time, StoneX Financial Pty Ltd (“we”, “our”) website may contain links to other sites and/or resources provided by third parties. These links and/or resources are provided for your information only and we have no control over the contents of those materials, and in no way endorse their content. Any analysis, opinion, commentary or research-based material on our website is for information and educational purposes only and is not, in any circumstances, intended to be an offer, recommendation or solicitation to buy or sell. You should always seek independent advice as to your suitability to speculate in any related markets and your ability to assume the associated risks, if you are at all unsure. No representation or warranty is made, express or implied, that the materials on our website are complete or accurate. We are not under any obligation to update any such material.
As such, we (and/or our associated companies) will not be responsible or liable for any loss or damage incurred by you or any third party arising out of, or in connection with, any use of the information on our website (other than with regards to any duty or liability that we are unable to limit or exclude by law or under the applicable regulatory system) and any such liability is hereby expressly disclaimed.