



AUD/USD Creeps Higher Post GDP, Resistance Hovers Nearby
Australia’s Q2 GDP data came middle above expectations to lift AUD/USD marginally higher. But it is not enough to overshadow my bias for another dip lower for the Australian dollar over the near term.
Share this:

Australia’s Q2 GDP growth came in stronger than expected, giving the Reserve Bank of Australia (RBA) further reason to keep interest rates on hold until at least Q4. Household spending was notably firmer than anticipated, helping GDP accelerate to a seven-quarter high of 1.8% y/y (0.6% q/q). Combined with the upside surprise in the latest inflation gauge — not just a result of spiking electricity prices — the RBA has more justification to remain cautious on the policy outlook.
View related analysis:
View related analysis:

Chart prepared by Matt Simpson - data source: ABS, LSEG
- GDP rose 0.6% q/q, in line with its long-term average, while per capita growth edged up 0.2% q/q.
- Domestic final demand increased 0.5% q/q, though this was the slowest pace since 2022.
- Hours worked expanded for a fifth straight quarter (+0.5% in Q2).
- Productivity improved, with real gross value-added hours rising 0.5% (a five-month high).
The Australian dollar firmed slightly after the release, largely on reduced RBA cut expectations, though markets had already priced in a low probability of near-term easing. Beneath the headline strength, however, momentum within the economy looks to be cooling.
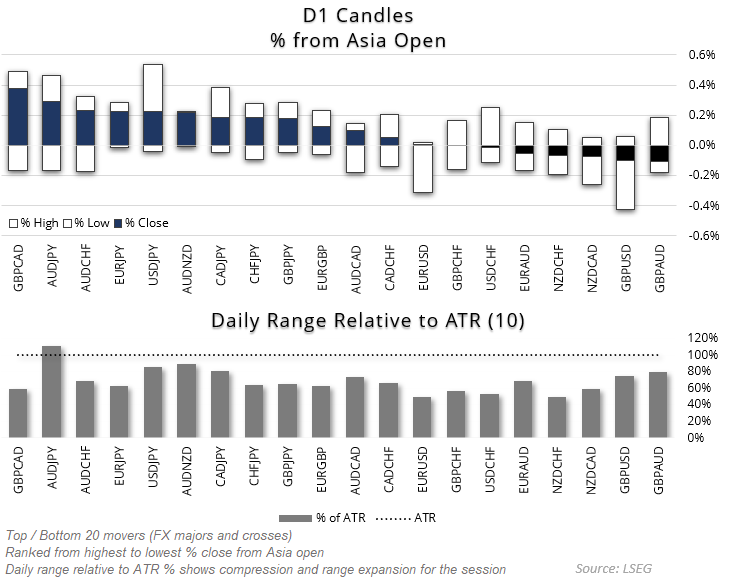
Chart prepared by Matt Simpson - data source: LSEG
- AUD/NZD climbed to a six-month high, trading near 1.1133.
- AUD/JPY extended gains above 97, on track for a sixth consecutive daily rise, with February and July highs now within reach.
- AUD/USD is holding above the 20-day EMA but is struggling to build momentum, with intraday ranges tight.
- AUD/CAD is pressing towards resistance at 0.90, though without a fresh catalyst a swing high could soon emerge.
AUD/USD Technical Analysis: Australian Dollar vs US Dollar
AUD/USD formed a bearish engulfing candle on Tuesday’s daily chart, hinting that the week’s high may already be locked in. On the 1-hour timeframe, price action is retracing higher from Tuesday’s sharp selloff, but the structure resembles a three-wave counter-trend correction rather than a sustainable rally.
Bears may look to fade minor rallies while price remains capped beneath the weekly high, keeping the near-term bearish bias intact. A move back towards the 200-day EMA at 0.6460 remains a realistic downside target.
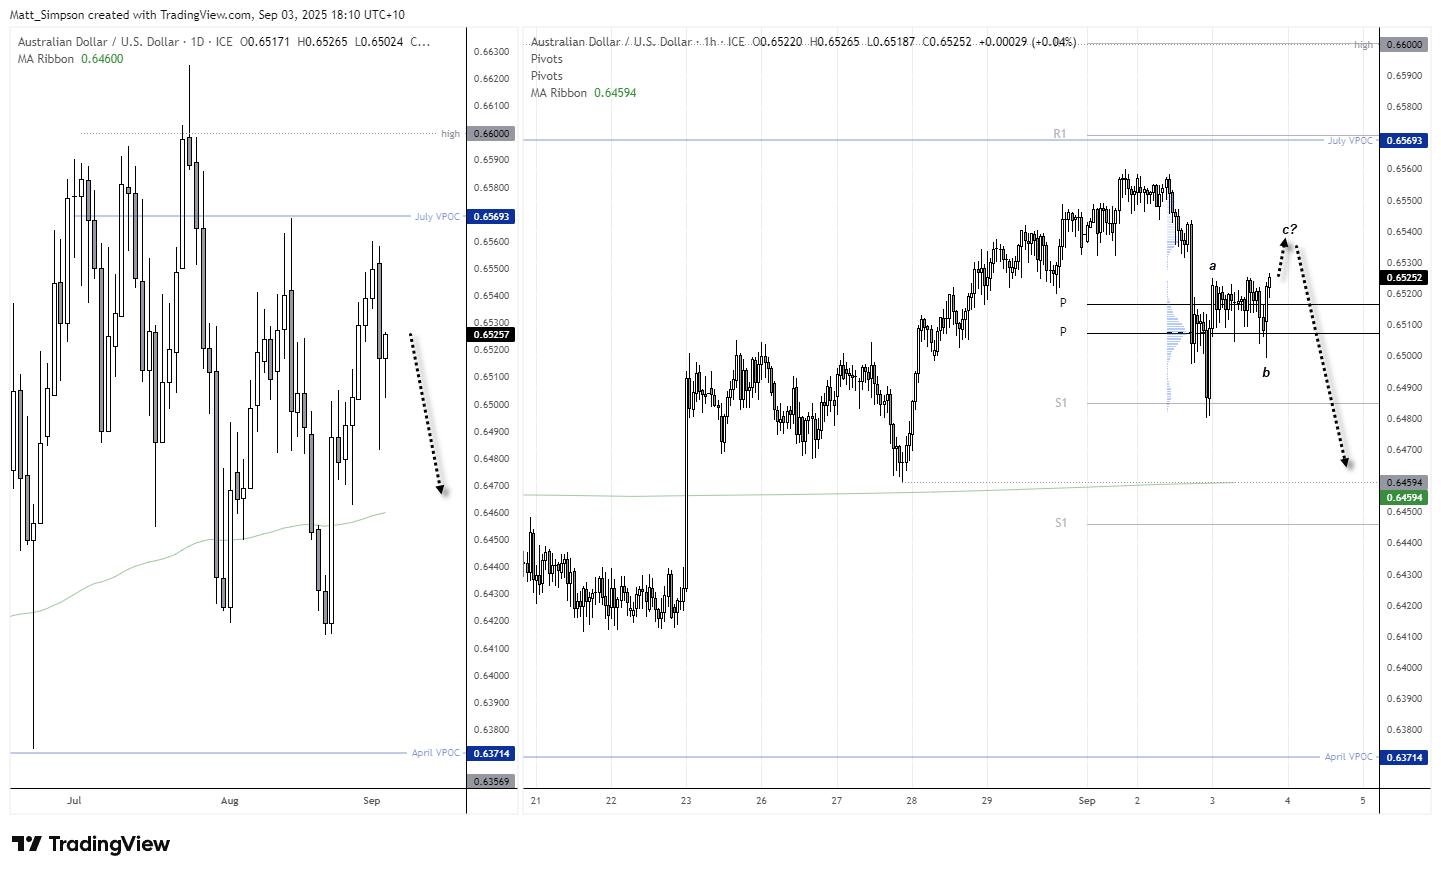
Chart analysis by Matt Simpson - data source: TradingView AUD/USD
View the full economic calendar
View the full economic calendar
-- Written by Matt Simpson
Follow Matt on Twitter @cLeverEdge
How to trade with City Index
You can trade with City Index by following these four easy steps:
- Open an account, or log in if you’re already a customer
• Open an account in the UK
• Open an account in Australia
• Open an account in Singapore
- Search for the market you want to trade in our award-winning platform
- Choose your position and size, and your stop and limit levels
- Place the trade
Related tags:



Open an account today
Experience award-winning platforms with fast and secure execution.
Economic calendar
Web Trader platform
Our sophisticated web-based platform is packed with features.
Related articles

US Dollar Freight Train Drives EUR/USD, GBP/USD to Fresh Lows
A hawkish Fed and growing jitters around AI have pushed a continued rally in the Greenback, and there’s not yet an end in sight.


Japanese Yen Forecast: USD/JPY Bulls Falter at Major Resistance—Critical Range Break in Focus 11 20 2026
USD/JPY’s latest retreat puts the September recovery under scrutiny, with nearby support offering bulls their next opportunity to respond.

silver-crash-2026-vs-2011-collapse
Silver has collapsed some 65% from its January peak, drawing uncomfortable comparisons with the 2011 crash. The parallels are striking, but a bigger bubble, a hawkish Federal Reserve and years of supply deficits make this episode different.

From time to time, StoneX Financial Pty Ltd (“we”, “our”) website may contain links to other sites and/or resources provided by third parties. These links and/or resources are provided for your information only and we have no control over the contents of those materials, and in no way endorse their content. Any analysis, opinion, commentary or research-based material on our website is for information and educational purposes only and is not, in any circumstances, intended to be an offer, recommendation or solicitation to buy or sell. You should always seek independent advice as to your suitability to speculate in any related markets and your ability to assume the associated risks, if you are at all unsure. No representation or warranty is made, express or implied, that the materials on our website are complete or accurate. We are not under any obligation to update any such material.
As such, we (and/or our associated companies) will not be responsible or liable for any loss or damage incurred by you or any third party arising out of, or in connection with, any use of the information on our website (other than with regards to any duty or liability that we are unable to limit or exclude by law or under the applicable regulatory system) and any such liability is hereby expressly disclaimed.