







AUD/USD mulls 64c breakout, US yields hint at swing high post Fed
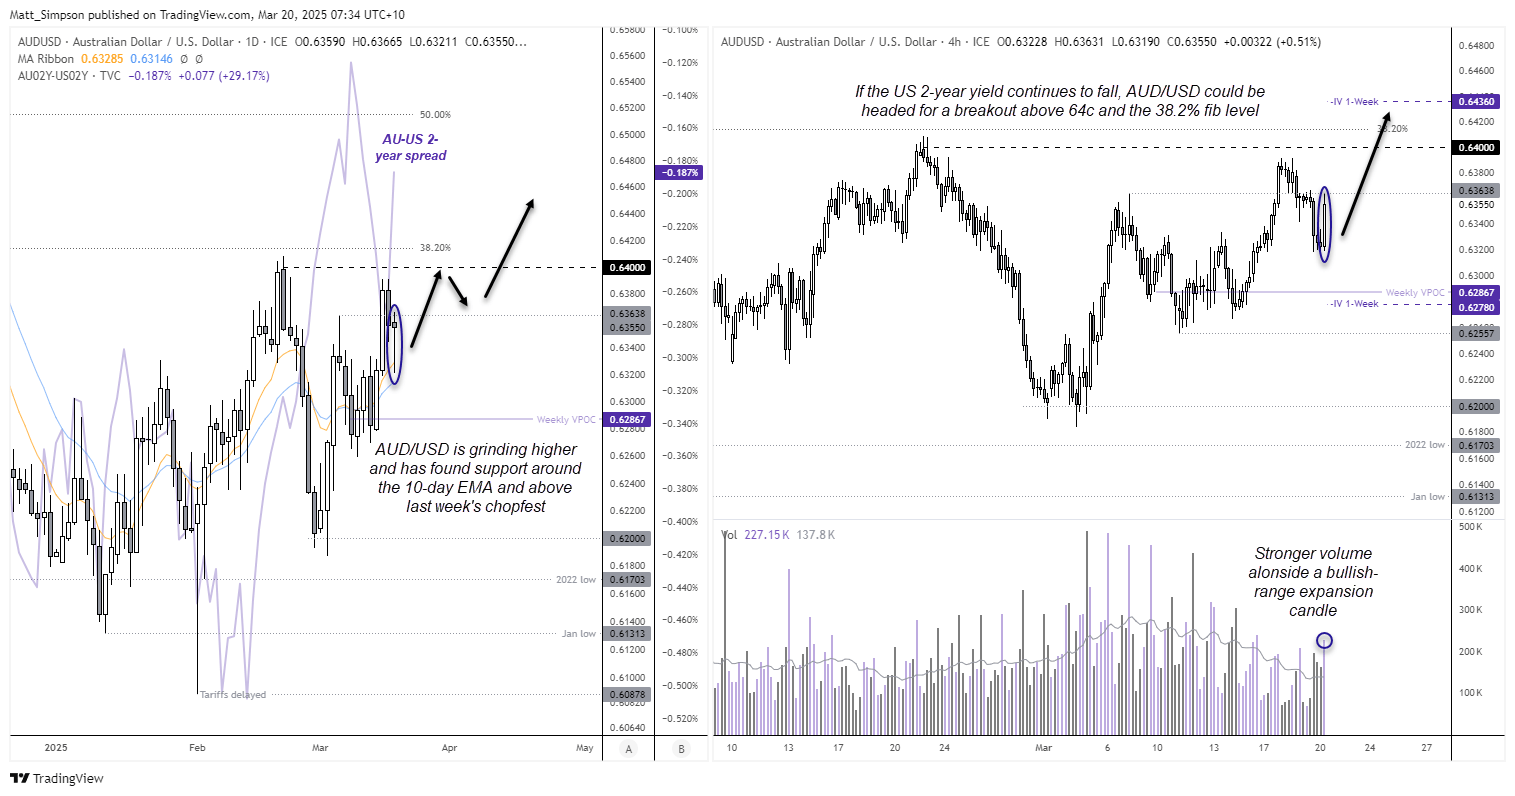
With US yields lower and hinting at a swing high, the relationship between AUD/USD and the AU-US 2-year spread appear to be back on talking terms. And that could bode well for AUD/USD bulls if US yields continue to fall in line with my bias.
Share this:

View related analysis:
- AUD/USD Forecast: FOMC, AU Jobs to Wake the Aussie Up From Its Lull?
- USD/JPY Hits Speed Bump at 150 Ahead of BOJ and FOMC, ASX to Open Lower
- Gold's Surge is Leaving Traders for Dust: Matt's 2-Minute Take
View related analysis:
While the Fed downgraded growth and upgraded their inflation forecast in light of Trump’s tariffs, they opted for a ‘wait and see’ approach regarding rates by keeping them at 3.9% for 2025, unchanged from their December forecasts. If anything, I felt they may have trimmed some easing out of the equation for this year, so from that angle it could be seen as dovish for the Fed to retain 50bp of cuts on the table.
- The Fed held rates steady at 4.25% - 4.5% as widely expected
- Lowered their 2025 growth outlook to 1.7% (down from 2.1%) and 2026 GDP to 1.8% (down from %)
- Core PCE for 2025 increased to 2.7% (2.5% prior)
- PCE increased to 2.8% (2.5% prior)
- Fed Funds rate unchanged at 3.9% for 2025 and 3.4% for 2026
- Balance sheet runoff to be slowed from April
Wall Street traders took the dovish tilt as good news, with the S&P 500, Nasdaq and Dow Jones were all up on the day. Although volatility was contained. Gold continued to a new high, as it doesn’t seem to know how to do much else these days.
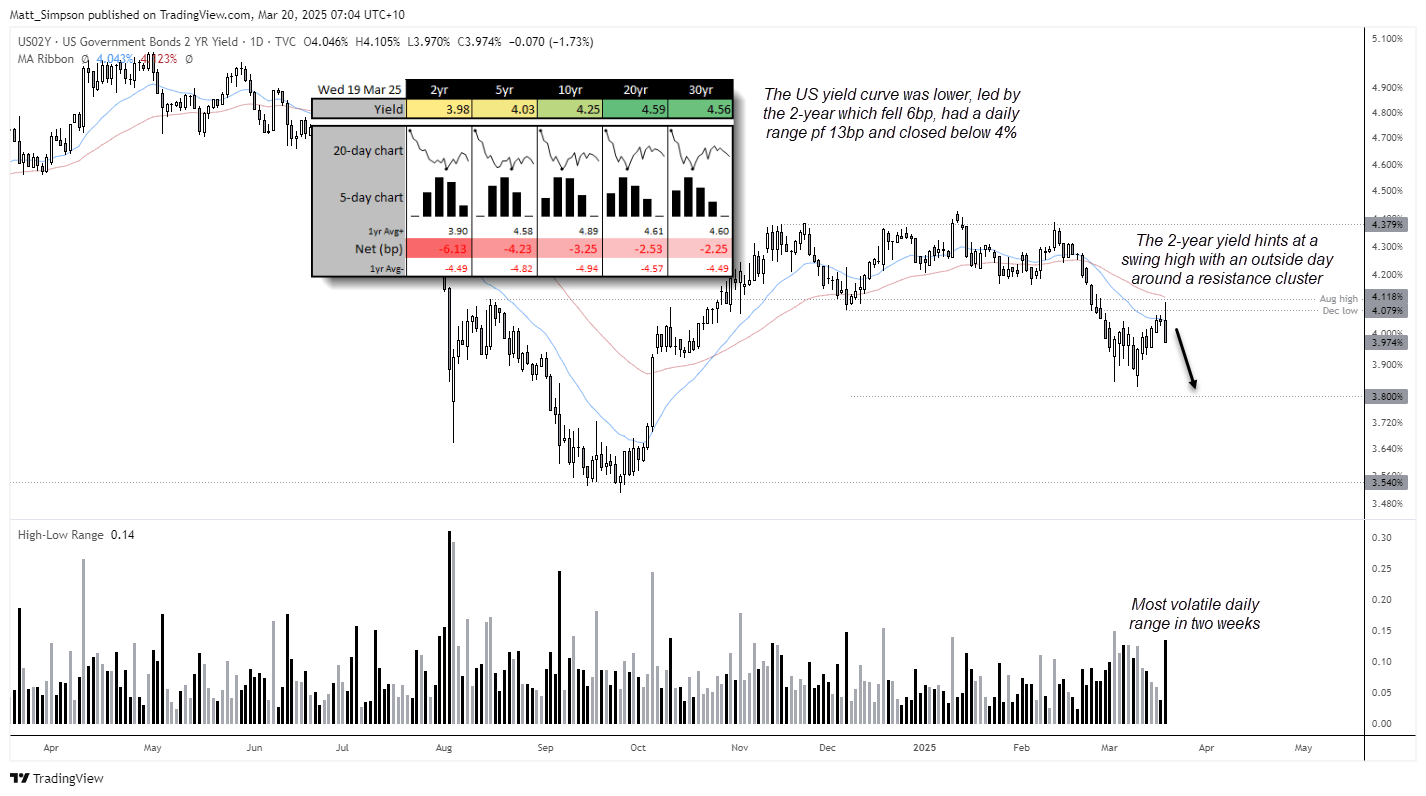
It was the most volatile day for the 2-year yield in two weeks, with its bearish outside day spanned 13bp to close -6bp lower and back beneath 4%. The recovery from 3.83% stalled around the December low, August high and 50-day EMA, further adding to the case that a swing high on yields may have been seen.
AUD/USD technical analysis
While AUD/USD closed flat following the Fed meeting, its lower wick on the day shows demand around the 10 and 20-day EMAs, around last week’s choppy range. And as messy as price action may have been, it is grinding higher since its rebound from 62c.
Yield differentials appear to be making a comeback, with the AU-US 2-year rising alongside AUD/USD this week. The relationship between the two was weak heading into last week, but they appear to now be back on talking terms again.
It should be noted that the differential is rising due to a drop in US yields as opposed to a rise in AU yields, but the bearishness of the US 2-year chart does look appealing enough to at least support AUD/USD over the near term.
The 4-hour chart shows a strong bullish bar accompanied with rising volume, which suggest a swing low around 0.6320. Bulls could seek dips within that candles range in anticipation of a move up to 64c. But for a break above it strong enough to clear the 38.2% Fibonacci level, we likely need a strong AU employment report alongside a continued selloff on the US 2-year yield.
Economic events in focus (AEDT)
The Bank of England (BOE) are likely to become the third major central bank to hold rates this week. Sticky inflation gives little room for cuts, even if there are two dissenters within the ranks – which likely leaves it 7-2 in favour of no action today. Still, some estimate that there could be as many as three cuts this year.
You can read my thoughts on Australia’s employment situation in the AUD/USD outlook article linked above, but in a nutshell it is likely to remain robust and not allow RBA doves to jeer for an imminent RAB rate cut. If it comes in strong enough, it could help AUD/USD head for 64c again.
- 00:00 – Japanese Public Holiday (Vernal Equinox)
- 08:45 – New Zealand Q4 GDP
- 11:30 – Australian Employment (Feb)
- 12:00 – PBOC Loan Prime Rate
- 18:00 – UK Earnings, Claimant Count, Employment Change
- 19:30 – SNB Interest Rate Decision (25bp cut expected)
- 23:00 – BOE Interest Rate Decision, MPC Votes (No Change Expected)
- 23:30 – BOE Governor Bailey Speaks
- 23:30 – US Jobless Claims, Philly Fed Manufacturing
ASX 200 at a glance
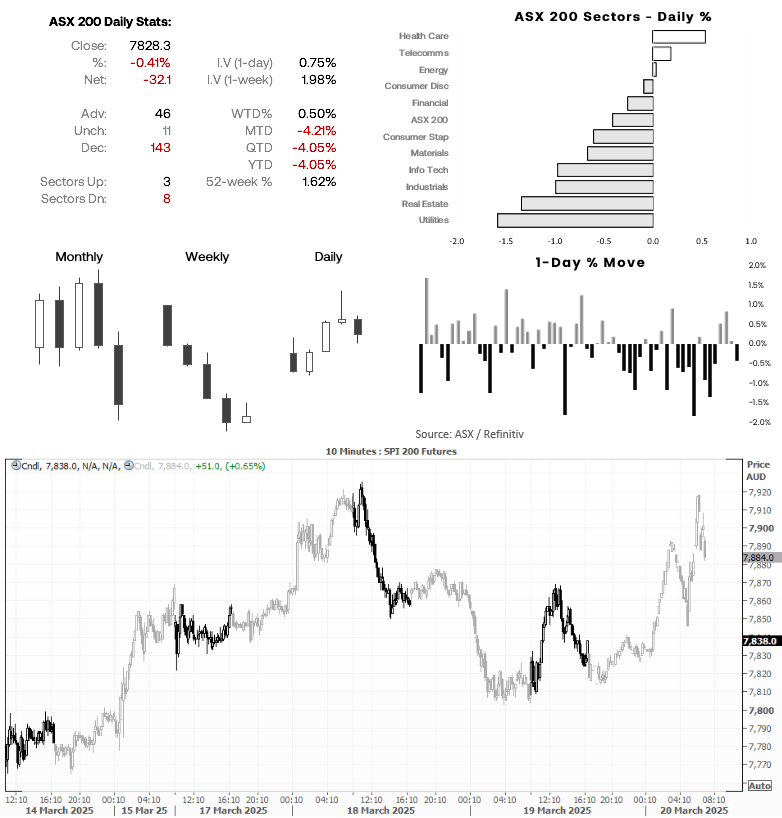
- The ASX 200 snapped a 3-day winning streak,
- Info tech is the weakest the 10 ASX sectors this past four weeks, down -19.3% while utilities is the only ASX sector to gain at 4%
- The bounce on Wal Street helped ASX 200 (SPI 200) futures rise 0.5% overnight, which points to a positive open for the ASX cash index today
-- Written by Matt Simpson
Follow Matt on Twitter @cLeverEdge
How to trade with City Index
You can trade with City Index by following these four easy steps:
- Open an account, or log in if you’re already a customer
• Open an account in the UK
• Open an account in Australia
• Open an account in Singapore
- Search for the market you want to trade in our award-winning platform
- Choose your position and size, and your stop and limit levels
- Place the trade



Open an account today
Experience award-winning platforms with fast and secure execution.
Economic calendar
Web Trader platform
Our sophisticated web-based platform is packed with features.
Related articles

silver-crash-2026-vs-2011-collapse
Silver has collapsed some 65% from its January peak, drawing uncomfortable comparisons with the 2011 crash. The parallels are striking, but a bigger bubble, a hawkish Federal Reserve and years of supply deficits make this episode different.


Nasdaq 100, SOX: Tech rout may be a symptom of something far larger
The financial tide is going out, and some of the market's biggest winners are being hammered. Our research suggests there's more to the tech rout than the AI headlines.


ASX 200 On Track for Worst Week in Four Years, Raising Bear Market Fears
The ASX 200 faces its worst week in four years as falling commodities, China's economic weakness and broad-based selling threaten a deeper correction.
From time to time, StoneX Financial Pty Ltd (“we”, “our”) website may contain links to other sites and/or resources provided by third parties. These links and/or resources are provided for your information only and we have no control over the contents of those materials, and in no way endorse their content. Any analysis, opinion, commentary or research-based material on our website is for information and educational purposes only and is not, in any circumstances, intended to be an offer, recommendation or solicitation to buy or sell. You should always seek independent advice as to your suitability to speculate in any related markets and your ability to assume the associated risks, if you are at all unsure. No representation or warranty is made, express or implied, that the materials on our website are complete or accurate. We are not under any obligation to update any such material.
As such, we (and/or our associated companies) will not be responsible or liable for any loss or damage incurred by you or any third party arising out of, or in connection with, any use of the information on our website (other than with regards to any duty or liability that we are unable to limit or exclude by law or under the applicable regulatory system) and any such liability is hereby expressly disclaimed.