


Australian Dollar Outlook: AUD/USD Breakout, AUD/JPY Mean Reversion?
AUD/USD eyes a bearish breakout as options markets stay calm, while AUD/JPY shows signs of mean reversion after a shooting-star reversal at resistance.
Share this:

A solid NFP print of 119k was undermined by a rise in unemployment to 4.4%, though the lift in participation leaves it closer to a strong report than a weak one. The US Dollar Index pushed to a six-month high, and Wall Street reversed opening gains to close with bearish engulfing candles. The volatility fed straight into the Australian dollar, which is increasingly following moves in the US dollar and S&P 500 rather than yield spreads or the renminbi.
This content will only appear on City Index websites!
View related analysis:
This content will only appear on Forex websites!
View related analysis:
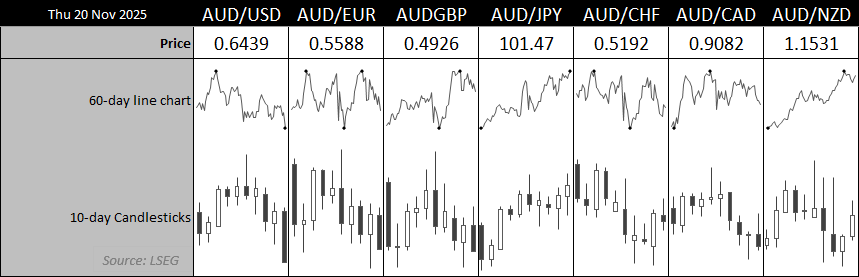
Chart prepared by Matt Simpson - source: LSEG
While the Australian dollar has posted minor gains against the New Zealand dollar, Swiss franc and Japanese yen so far this week, it’s on track to form bearish engulfing or outside weeks against the US dollar, Canadian dollar, British pound and euro. The ASX 200 is also on course for its fourth straight weekly decline and its most bearish week in eight months.


AUD/USD Ignores Yield Differentials, Options Market Stays Calm
Still, Aussie dollar options traders still do not seem overly concerned with a larger bearish move, with the 1-week and 1-month risk reversals remaining elevated compared to prices. If they were more confident of a breakout, I’d have expected to see the RRs increase their negative skew to show a rise of puts (bearish calls) relative to calls (bullish bets). Perhaps that could change if AUD/USD actually breaks lower by a meaningful amount, but for now they have taken the weaker AUD/USD within their stride. Implied vitality is also lower, which is not one would expect following a relatively volatile down day.
Also note how AUD/USD is ignoring yield differentials for now, with the AU-US 2-year spread continuing to rise despite the lower Australian dollar. It really does just seem to be tied to the direction of the US dollar these days.

Chart analysis by Matt Simpson - source: LSEG
AUD/USD Technical Analysis: Australian Dollar vs US Dollar
The Australian dollar is on track for its most bearish week in six, having opened near the weekly high and now trading at the lows. AUD/USD traders are watching the October low, and barring a sharp turnaround in sentiment, a bearish break looks increasingly likely.
However, the key level for bears to clear is the August low at 0.6414, with the 50-week SMA (0.6412) sitting just beneath it. The 0.6400–0.6410 zone is loaded with support, so while another dip lower is possible, AUD/USD may initially hold above 64c.
The daily chart shows AUD/USD has closed below the 200-day SMA (0.6457) for the first time since late May. With prices resting on the October low, a minor bounce toward the 200-day SMA isn’t out of the question — and bears may look to fade that move in anticipation of a break lower, targeting the 0.6400–0.6410 region in the near term.
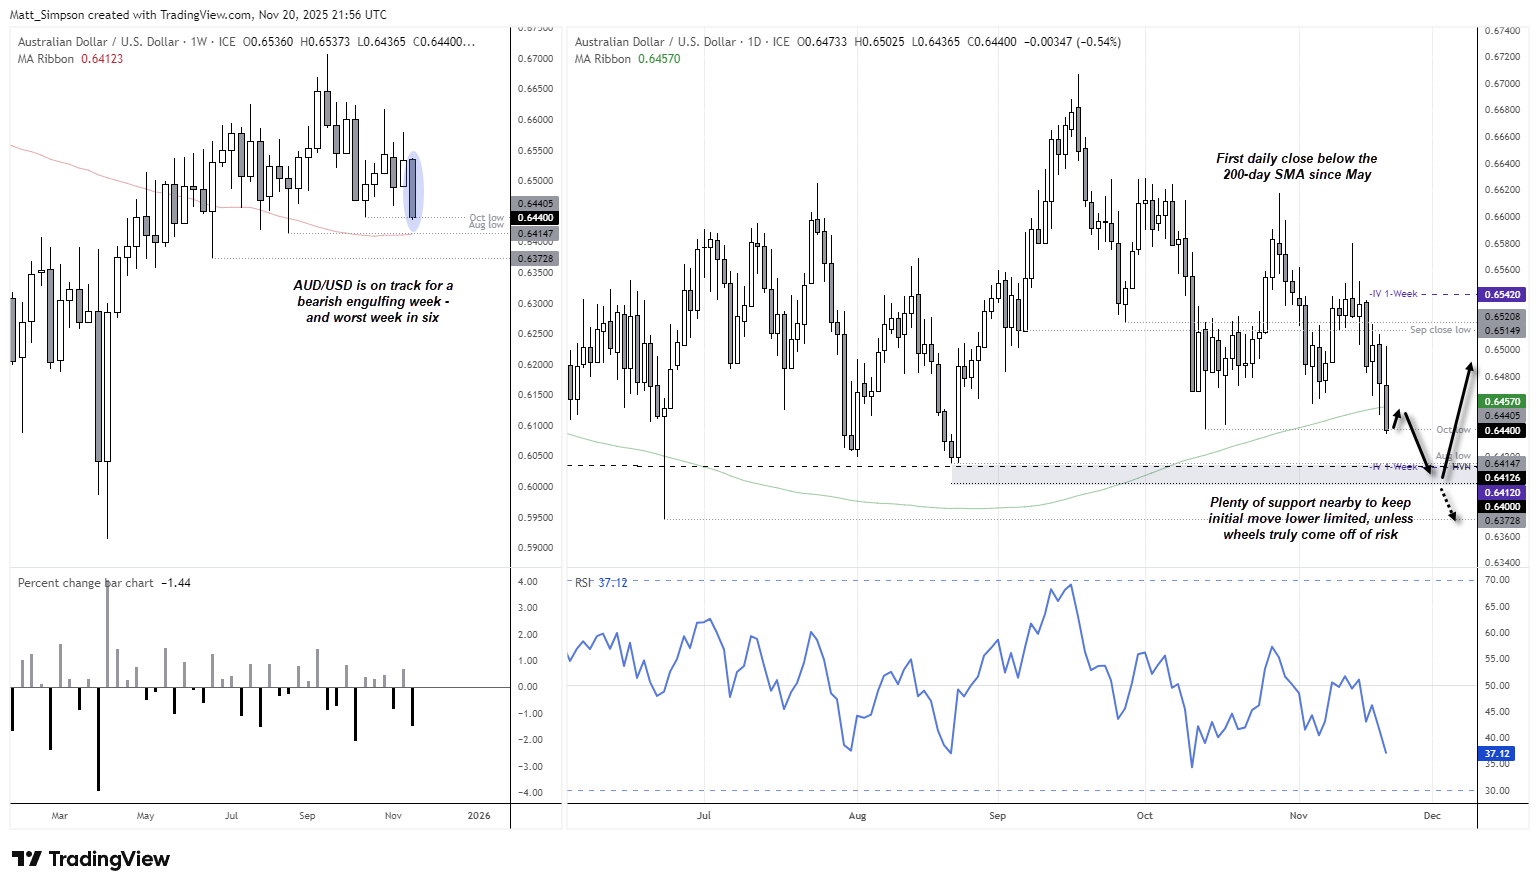
Chart analysis by Matt Simpson - source: TradingView AUD/USD
AUD/JPY Technical Analysis: Australian Dollar vs Japanese Yen
The Australian dollar failed to take advantage of a weaker Japanese yen. Given AUD/JPY met resistance at the November high with a 1-bar bearish reversal pattern (shooting star), my bias is now for at least a near-term reversal against its bullish trend.
The daily RSI (14) has developed a multi-week bearish divergence, and price action appears to be extended from its 20-day and possible 50-day EMA.
I would not personally label this as a rising wedge pattern, but I believe there is enough there to call for some mean reversion. But that could quickly turn into a trend reversal should appetite for risk worsen, given the Australian dollar’s relative underperformance against the weak yen in recent weeks.
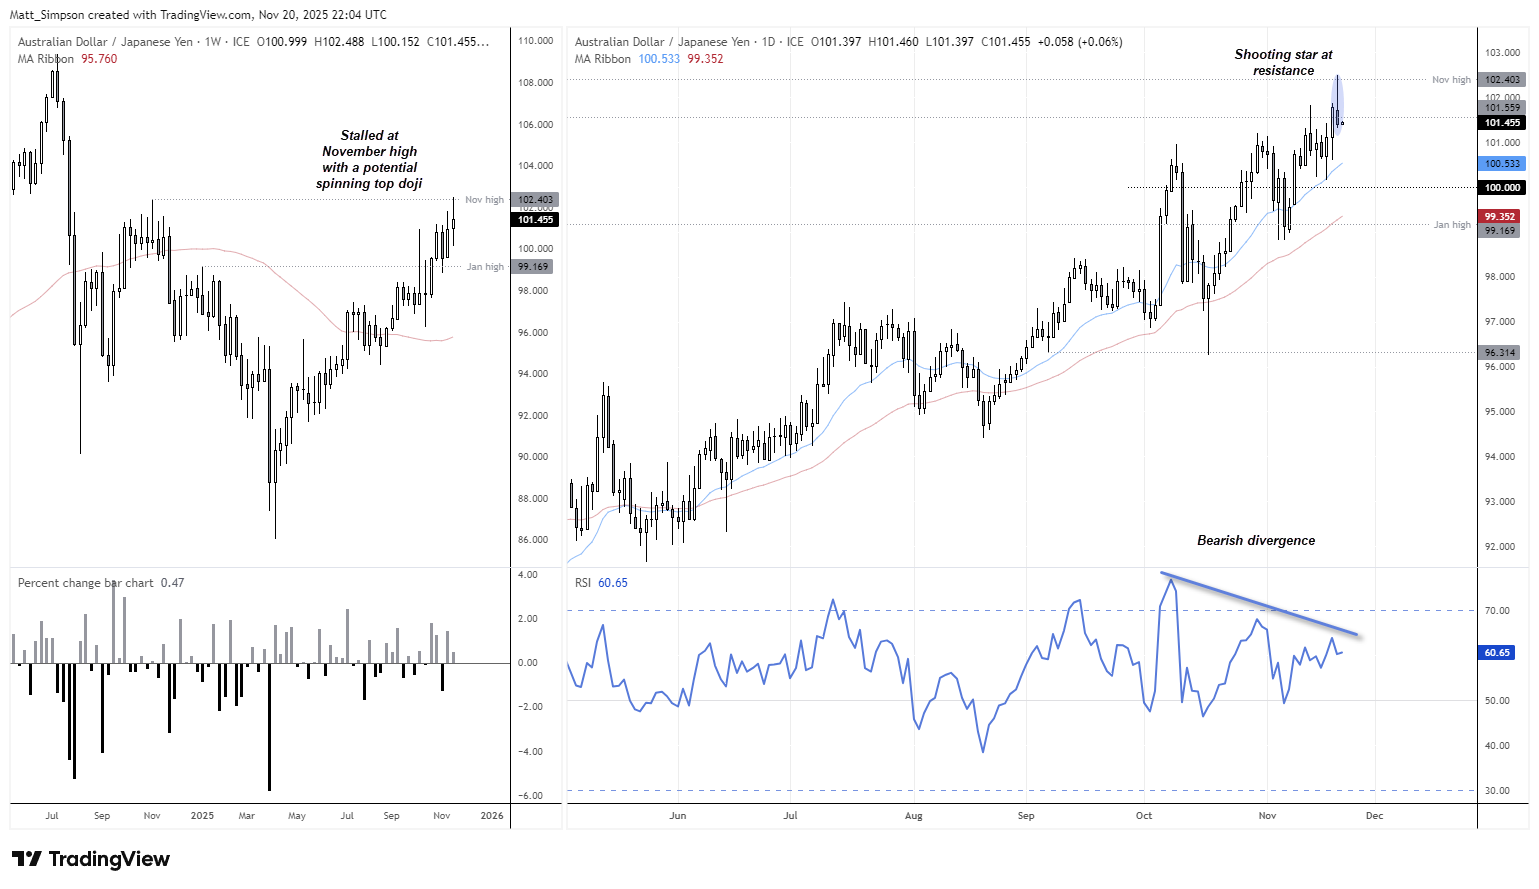
Chart analysis by Matt Simpson - data source: TradingView AUD/JPY


Key Economic Events for Traders (AEDT / GMT+11)
08:45 NZD Trade Data: Exports, Imports, Trade Balance, Annual Balance (NZD/USD, AUD/NZD, NZD/JPY)
09:00 AUD PMIs: Manufacturing & Services PMI, Judo Manufacturing PMI, Judo Services PMI (AUD/USD, AUD/JPY, AUD/NZD)
10:30 JPY CPI Data: CPI, Core CPI, CPI, CPI (USD/JPY, EUR/JPY, AUD/JPY)
10:50 JPY Trade Data: Adjusted Balance, Exports, Imports, Trade Balance (USD/JPY, AUD/JPY, EUR/JPY)
11:01 GBP GfK Consumer Confidence (GBP/USD, EUR/GBP, GBP/JPY)
11:30 JPY PMIs: Composite PMI, Manufacturing PMI, Services PMI (USD/JPY, EUR/JPY, AUD/JPY)
13:00 NZD Credit Card Spending (NZD/USD, AUD/NZD, NZD/JPY)
18:00 GBP Retail Indicators: Core Retail Sales, Retail Sales, Net Borrowing, Cash Requirement (GBP/USD, EUR/GBP, FTSE 100)
19:30 EUR Germany PMIs: Composite PMI, Manufacturing PMI, Services PMI (EUR/USD, EUR/GBP, DAX)
19:30 EUR ECB President Lagarde Speaks (EUR/USD, EUR/GBP, DAX)
20:00 EUR Eurozone PMIs: Manufacturing PMI, Composite PMI, Services PMI (EUR/USD, EUR/GBP, Euro Stoxx 50)
20:30 GBP PMIs: Composite PMI, Manufacturing PMI, Services PMI (GBP/USD, EUR/GBP, FTSE 100)
22:30 EUR ECB’s De Guindos Speaks (EUR/USD, EUR/GBP, DAX)
23:00 CNY FDI (USD/CNH, AUD/USD, Hang Seng Index)
23:30 USD FOMC Member Williams Speaks (S&P 500, Nasdaq 100, USD/JPY)
23:40 CHF SNB Vice Chairman Schlegel Speaks (USD/CHF, EUR/CHF, SMI)
Saturday, November 22, 2025
00:00 USD Federal Budget Balance (S&P 500, Nasdaq 100, USD/JPY)
00:00 EUR German Buba President Nagel Speaks (EUR/USD, EUR/GBP, DAX)
00:30 USD Fed Vice Chair for Supervision Barr Speaks (S&P 500, Nasdaq 100, USD/JPY)
00:30 USD Real Earnings (S&P 500, Nasdaq 100, USD/JPY)
00:30 CAD Retail Indicators: Core Retail Sales, Housing Price Index, Retail Sales (USD/CAD, CAD/JPY, S&P/TSX)
00:31 CAD Retail Sales (Oct) (USD/CAD, CAD/JPY, S&P/TSX)
01:00 USD Fed Logan Speaks (S&P 500, Nasdaq 100, USD/JPY)
01:15 USD Industrial Indicators: Capacity Utilization, Industrial Production (S&P 500, Nasdaq 100, USD/JPY)
01:45 USD PMIs: Manufacturing PMI, Composite PMI, Services PMI (S&P 500, Nasdaq 100, USD/JPY)
02:00 USD Housing Starts, Michigan Consumer Indicators (S&P 500, Nasdaq 100, USD/JPY)
02:00 USD Wholesale Inventories (S&P 500, Nasdaq 100, USD/JPY)
02:30 CAD BoC Senior Loan Officer Survey (USD/CAD, CAD/JPY, S&P/TSX)
02:40 GBP BoE MPC Member Pill Speaks (GBP/USD, EUR/GBP, FTSE 100)
View the full economic calendar
View the full economic calendar
-- Written by Matt Simpson
Follow Matt on Twitter @cLeverEdge
How to trade with City Index
You can trade with City Index by following these four easy steps:
- Open an account, or log in if you’re already a customer
• Open an account in the UK
• Open an account in Australia
• Open an account in Singapore
- Search for the market you want to trade in our award-winning platform
- Choose your position and size, and your stop and limit levels
- Place the trade
Related tags:
Latest market news




Open an account today
Experience award-winning platforms with fast and secure execution.
Economic calendar
Web Trader platform
Our sophisticated web-based platform is packed with features.
Related articles
AUD/USD Outlook: Macro Forces Collide Ahead of US, AU Inflation
Macro forces have hammered the Australian dollar, but could sticky inflation catch AUD/USD bears off guard after a bruising week?

US Dollar Freight Train Drives EUR/USD, GBP/USD to Fresh Lows
A hawkish Fed and growing jitters around AI have pushed a continued rally in the Greenback, and there’s not yet an end in sight.


Japanese Yen Forecast: USD/JPY Bulls Falter at Major Resistance—Critical Range Break in Focus 11 20 2026
USD/JPY’s latest retreat puts the September recovery under scrutiny, with nearby support offering bulls their next opportunity to respond.

From time to time, StoneX Financial Pty Ltd (“we”, “our”) website may contain links to other sites and/or resources provided by third parties. These links and/or resources are provided for your information only and we have no control over the contents of those materials, and in no way endorse their content. Any analysis, opinion, commentary or research-based material on our website is for information and educational purposes only and is not, in any circumstances, intended to be an offer, recommendation or solicitation to buy or sell. You should always seek independent advice as to your suitability to speculate in any related markets and your ability to assume the associated risks, if you are at all unsure. No representation or warranty is made, express or implied, that the materials on our website are complete or accurate. We are not under any obligation to update any such material.
As such, we (and/or our associated companies) will not be responsible or liable for any loss or damage incurred by you or any third party arising out of, or in connection with, any use of the information on our website (other than with regards to any duty or liability that we are unable to limit or exclude by law or under the applicable regulatory system) and any such liability is hereby expressly disclaimed.