Bitcoin, BTC/USD Talking Points:
- Bitcoin sold off aggressively on Friday after news of increased tariffs on China, with BTC/USD pushing all the way down for a test of the 110k psychological level.
- I had written about this on Friday from a bigger picture perspective, and I also published a video with focus on the US Dollar after that tariff threat had re-entered the picture. So far, Bitcoin has held a bounce from the psychological level and bulls have an open door to make a run; but they’re now encountering resistance at the 115k handle.
- I’ll be looking into Bitcoin in the weekly webinar tomorrow, and you’re welcome to join. Click here to register.
It was one of those dramatic market closes last week as President Trump threatened increased tariffs on China, fueling a sell-off in risk assets as markets moved into the weekly close. This certainly isn’t the first tape bomb that Trump has dropped on a Friday, and it probably won’t be the last, but as I discussed in the video published that day, this seems to be by design as the weekend allows for President Trump to talk around the matter while leveraging the impact of the threat or statement. Sure enough, over the weekend President Trump had a softer tone on the matter and it didn’t seem as finalized, and as markets re-opened for the week a strong bounce has developed in both Bitcoin and stocks.
For the Friday video, the focus was largely on the USD, and I had tied the themes together then, as Trump’s comment also prodded a sell-off in the US Dollar. With both stocks and Bitcoin coming back to life today, so too has the USD, and this raises the question as to whether bullish continuation remains in favor for the Greenback.
It’s important to point out that the markets aren’t perfectly correlated. There will on occasion be symptoms of that, such as we saw last Friday, when a strong rally in the USD to go along with strong rallies in stocks and Bitcoin see profit taking and risk aversion after a new variable of risk. But – that does not mean that the themes have to hold, as we can certainly see backdrops of USD-weakness to go along with both equity and cryptocurrency strength.
USD and SPX Breakdown on Trump Tariff Return
Bitcoin Technicals
In the Friday article I took a longer-term look at Bitcoin while talking about the ‘debasement trade.’ This is a source of strength for Gold in the 100%+ rally that’s shown over the past year and a half, and when we did see pause in that rally as two bull pennants formed, it was Bitcoin that outperformed.
My thesis is that if we do finally see another pause in the gold rally after the $4k level has come into play – could Bitcoin be in a similar position to shine?
In the gold bull pennant in the final two months of last year, Bitcoin finally pushed above the 100k marker.
And then it was April of this year, right around the Easter holiday, that gold again found resistance, this time at the $3500 level. Bitcoin was pushing back above $88k at the time and trended all the way up to a fresh all-time-high a month later, and then another with a test at the 120k level in July.
It’s as if the severely overbought backdrops in gold drove anti-fiat flows into Bitcoin while gold prices coiled in continuation patterns. So, this isn’t necessarily looking for a top or a reversal in gold as much as a shift if we do see a level of resistance finally stand in the way of bulls for more than a couple of weeks.
Bitcoin Weekly Chart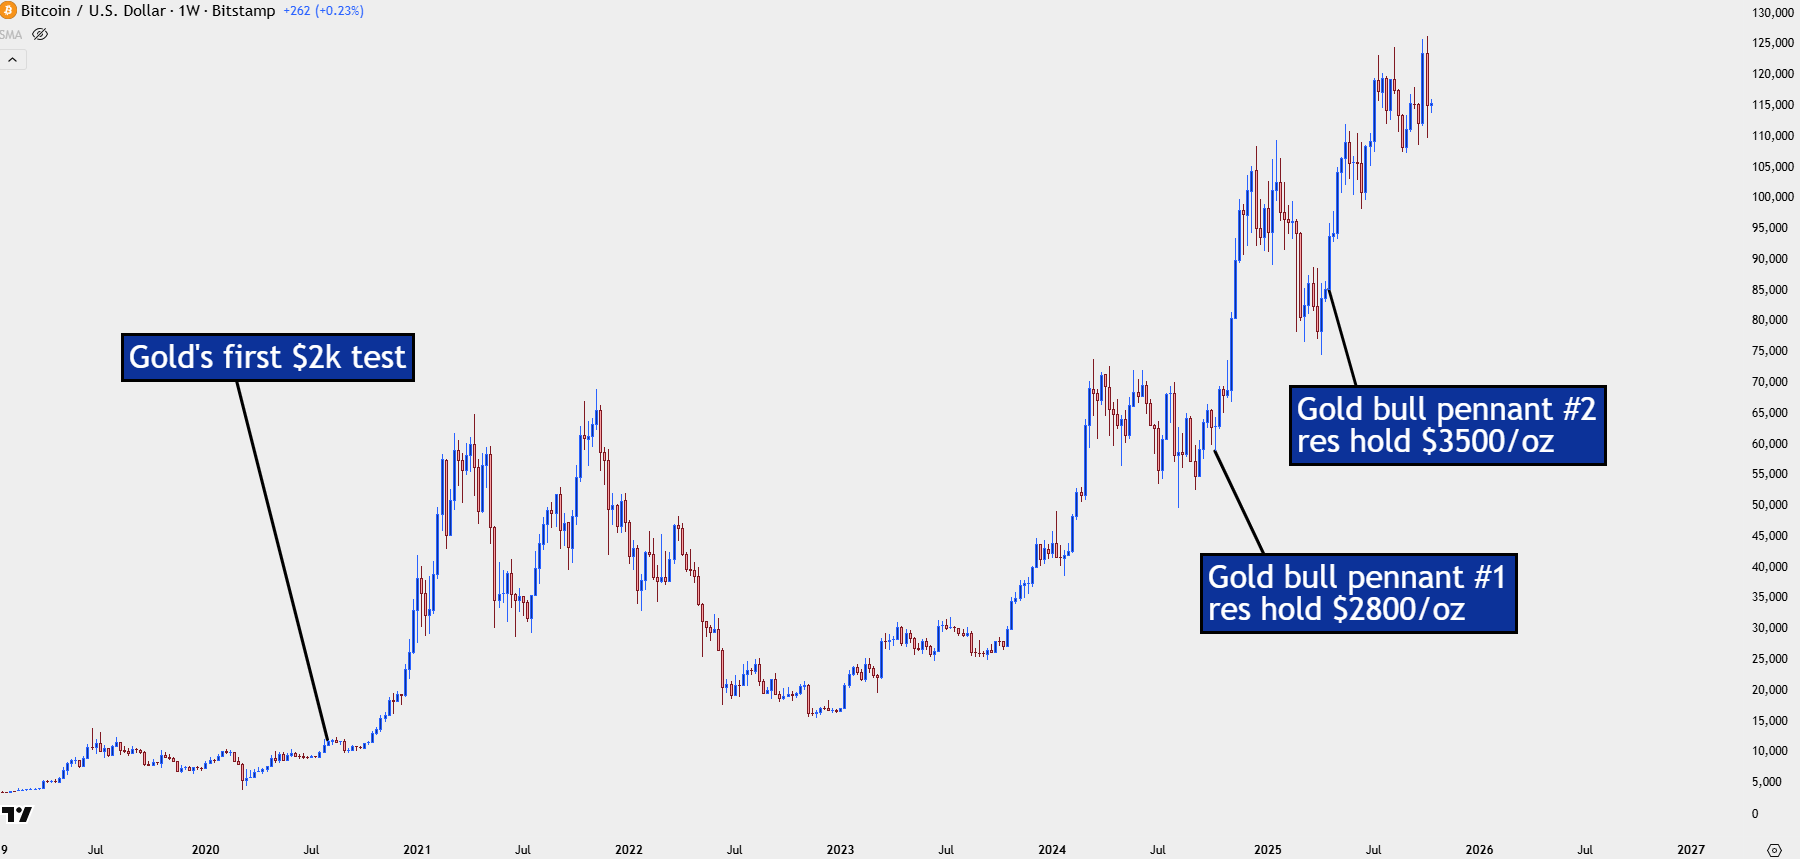
Chart prepared by James Stanley; data derived from Tradingview
Bitcoin – The Role of Psychological Levels
Interestingly psychological levels seem to be one of the more controversial systems of support and resistance. It is, after all, quite simple, but the reality is there’s a reason that most retailers price their products ending in amounts of 99 cents (or dollars for higher-priced items), and this can extend to products like automobiles. Quite simply, the price of $39,999.99 sounds much cheaper than just two cents less than $40,000.01. And because it sounds and seems cheaper, that difference of two cents can help to drive greater demand.
This can work in markets, too, and the $2k test in gold illustrates this well, where gold trading above $2k/oz seems much more expensive, and thereby makes it more difficult to drive greater demand. Perhaps it’s not instantaneous, such as we saw in that example, although it can be, like we saw at $3500/oz back in April.
These levels don’t necessarily mean that price must reverse, but think of it as any other product, let’s say a gallon of milk. If you go to the store and see a gallon of milk for $10 for the first time ever, you might be shocked to the point of deciding that you don’t need milk any longer. When the price goes back below that psychological waypoint, perhaps even to $9.99, your demand will likely increase to a degree. With time, the price above $10 will seem or feel normal and you won’t hesitate to buy if you actually need milk. This is price acceptance, and it happens in markets, too.
In Bitcoin, we saw this happen at $125k, where investors got ‘sticker shock’ when the saw that price trade for the first time ever. It didn’t amount to an automatic reversal as there was three days of testing there, but it did eventually lead to a pullback. But, think about what happened at this price, as Bitcoin pushed over $125k, those holding longs sold positions, going along with shorts opening fresh positions.
After the first day, bulls went up for a fresh higher-high on October 6th. But on the third day of testing when price poked back above that level, bulls were a bit more cautious, and that led to a stronger sell-off and that’s evidence of the resistance level playing out.
Initially a bounce at 120k was similarly faded, and that led to the sell-off last Friday that went all the way down to the 110k price.
Bitcoin Daily Price Chart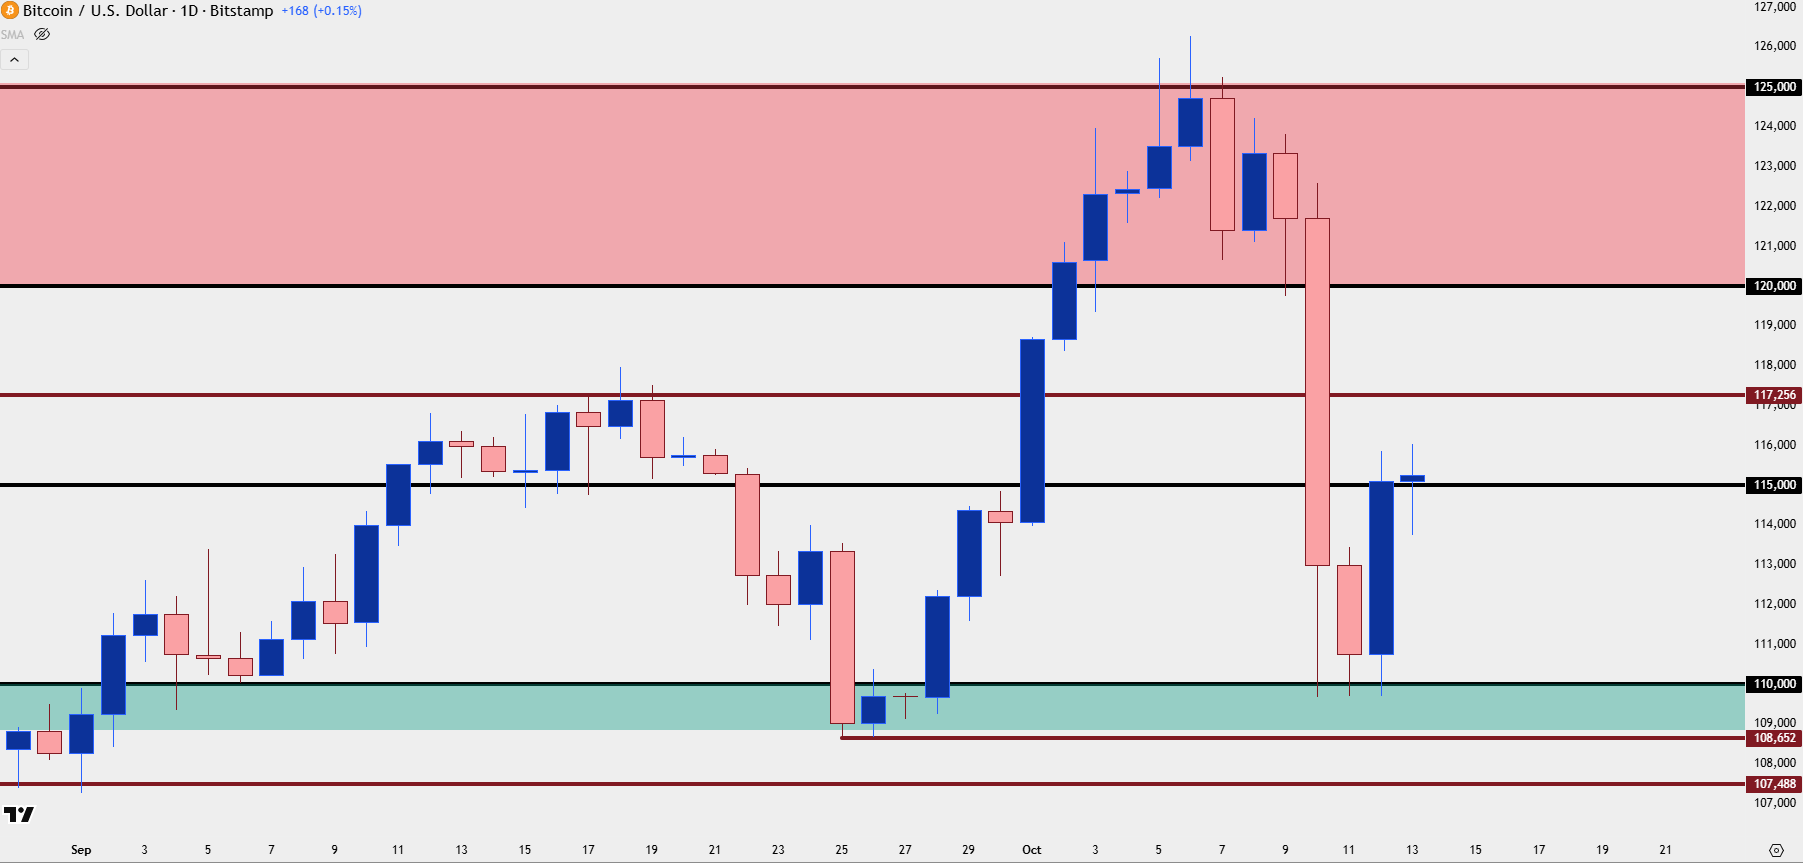
Chart prepared by James Stanley; data derived from Tradingview
Bitcoin Structure
The four-hour chart illustrates this well as there were multiple tests below that 110k price, and initially, sellers remained motivated as illustrated by the lower-highs taken from each corresponding bounce. That began to shift on Sunday morning, however, as buyers lifted price to short-term higher-highs and, eventually, a test of 115k, which remains in-play today.
Bitcoin Four-Hour Chart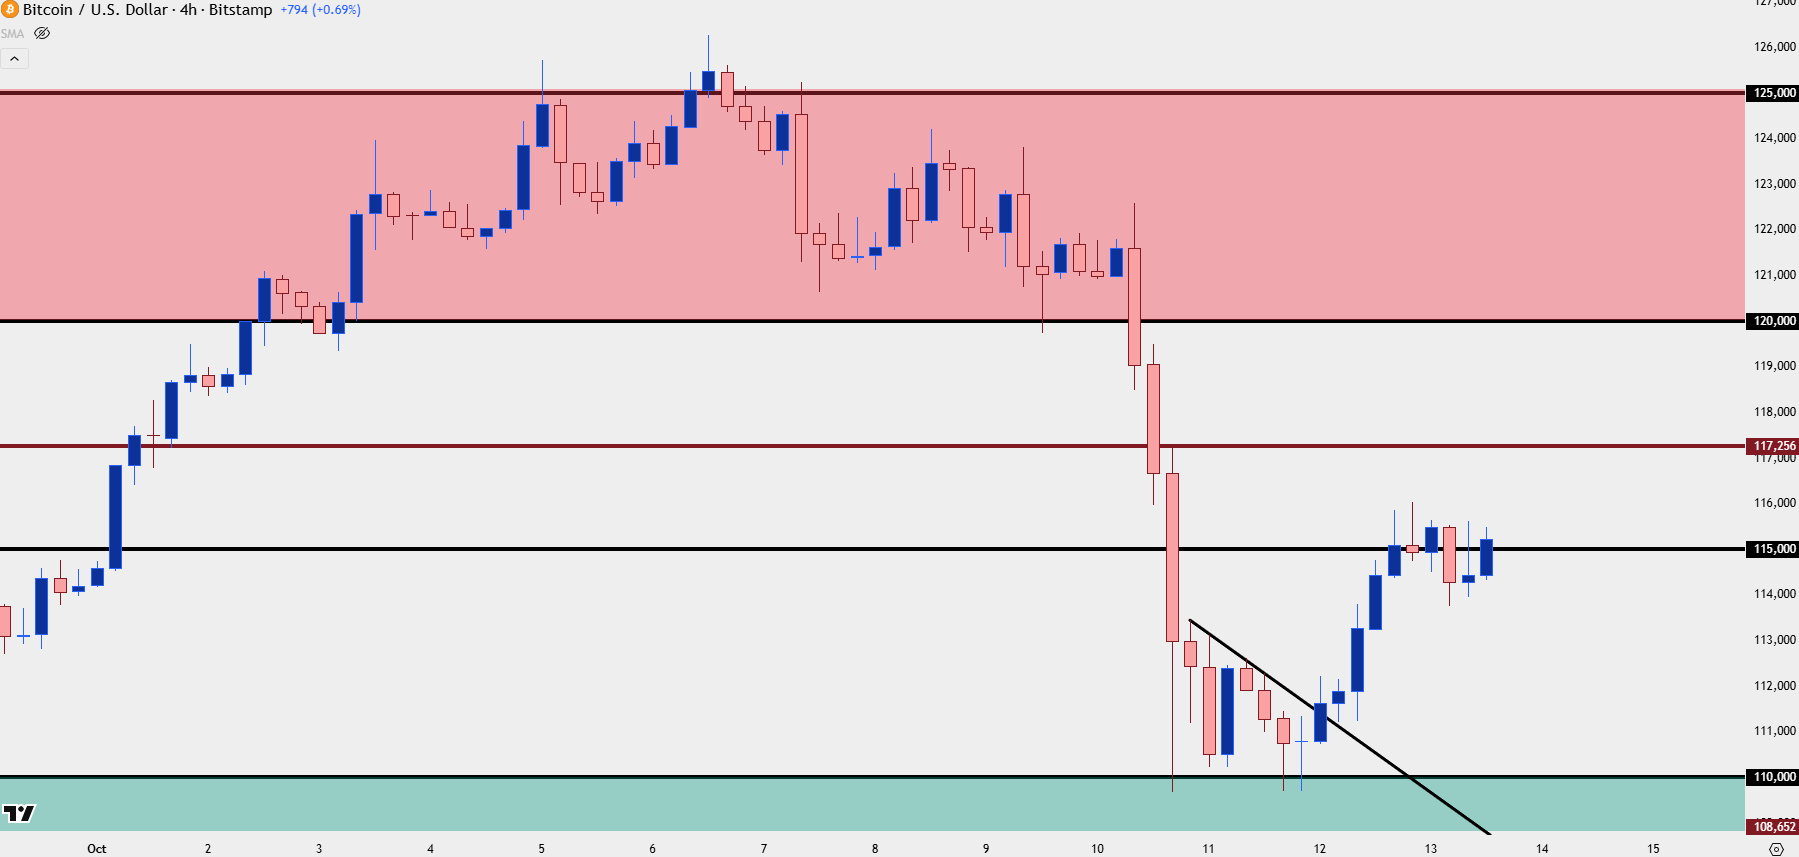
Chart prepared by James Stanley; data derived from Tradingview
--- written by James Stanley, Senior Strategist