



Crude Oil Weekly Outlook: Saudi–Houthi Escalation vs Key Resistance
Crude Oil Weekly Outlook: Despite escalating Houthi attacks on Saudi Arabia and continuing tensions between the United States and Iran, crude oil prices are now facing major resistance that must be overcome before another bullish rally can be confirmed.
Share this:

Despite escalating Houthi attacks on Saudi Arabia and continuing tensions between the United States and Iran, crude oil prices are now facing major resistance that must be overcome before another bullish rally can be confirmed. Houthi attacks on Saudi energy facilities and related injuries have been reported, while the wider U.S.–Iran conflict continues to threaten regional energy infrastructure and shipping routes.
The key resistance levels are:
- Brent (UKOIL): $108: The 7-month trendline that has acted as resistance after serving as support between March and June 2026, combined with the 78.6% Fibonacci retracement of the March–July decline.
- WTI (USOIL): $104.50: The corresponding 7-month trendline and the 78.6% Fibonacci retracement of the March–July downtrend.
Risks of another regional escalation remain elevated, particularly after new travel warnings and security alerts across the Middle East. At the same time, the latest sentiment peak may also signal a potential reversal. This suggests that markets could be shifting from pricing an imminent supply shock toward a prolonged but potentially manageable conflict.
Traders are increasingly focused on whether political and economic pressures, particularly ahead of the U.S. midterm elections, will encourage all sides to avoid actions that could trigger another major spike in energy prices.
Political and regional developments may become increasingly important as the Israeli and U.S. elections approach. Israel’s national election is scheduled for October 27, while the U.S. midterm elections are scheduled for November 3.
Trump has also said that the Iran conflict could end later this year, potentially after the U.S. midterm elections, and that oil prices could fall sharply once the war ends. These claims remain part of the political narrative rather than a confirmed resolution.
A sustained break above $108 for Brent and $104.50 for WTI, combined with a sustained hold in the energy sector ETF above its 18-year resistance, would likely confirm another bullish surge and place renewed pressure on risk appetite.
I cover this analysis in more detail in my weekly webinar, held every Tuesday
Register here for the next session
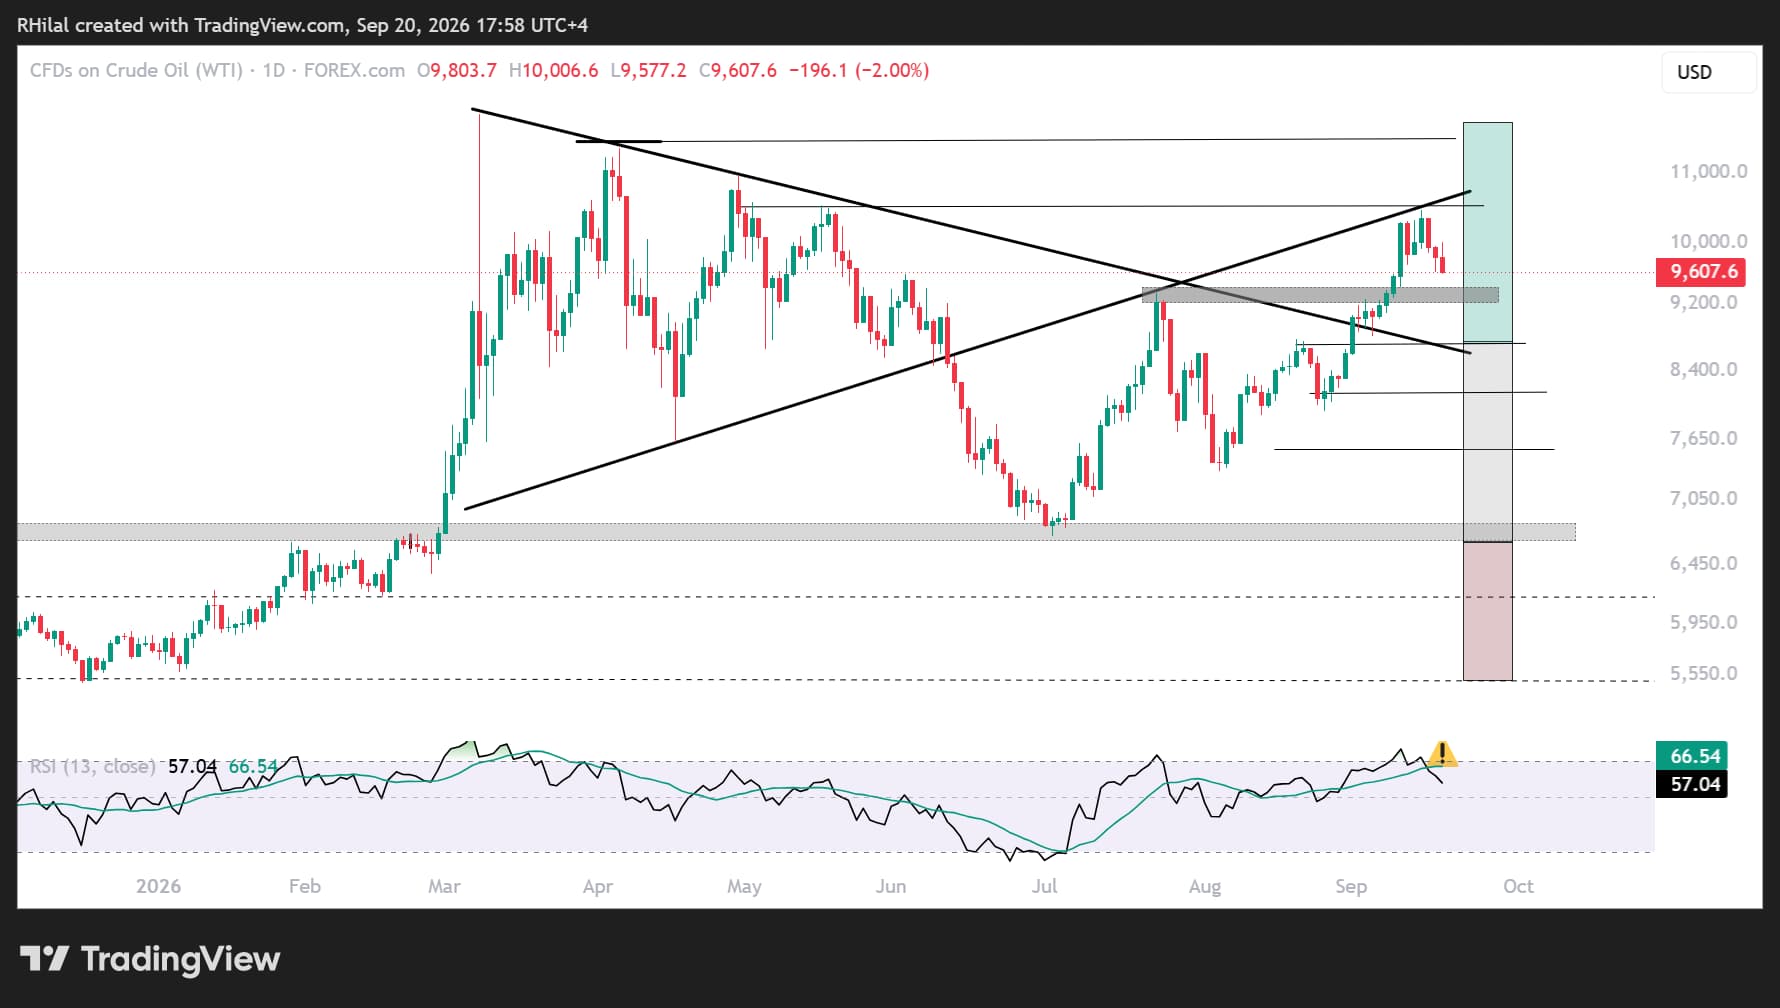
WTI Weekly Outlook — Log Scale
Source: TradingView
WTI price action has reached a major confluence zone, increasing the possibility that a short-term top may have formed.
The confluence zone includes:
- The 7-month trendline that served as support between March and June 2026 before turning into resistance between July and September 2026.
- The 78.6% Fibonacci retracement of the March–July 2026 downtrend near $104.50.
- Overbought momentum conditions last seen in March, close to the yearly highs.
The pullback was expected given the steepness of the rally and the importance of this confluence zone.
Bullish scenario: Reclaiming the $105 mark would restore the longer-term bullish outlook and reinforce inflationary and geopolitical escalation risks.
Such a move could redirect WTI toward the yearly highs.
Bearish scenario: A move back below the July 2026 high near $94 would support a short-term de-escalation narrative.
The next downside levels would be $92 and $86, corresponding to Fibonacci retracement levels of the advance between August 26 and September 11.
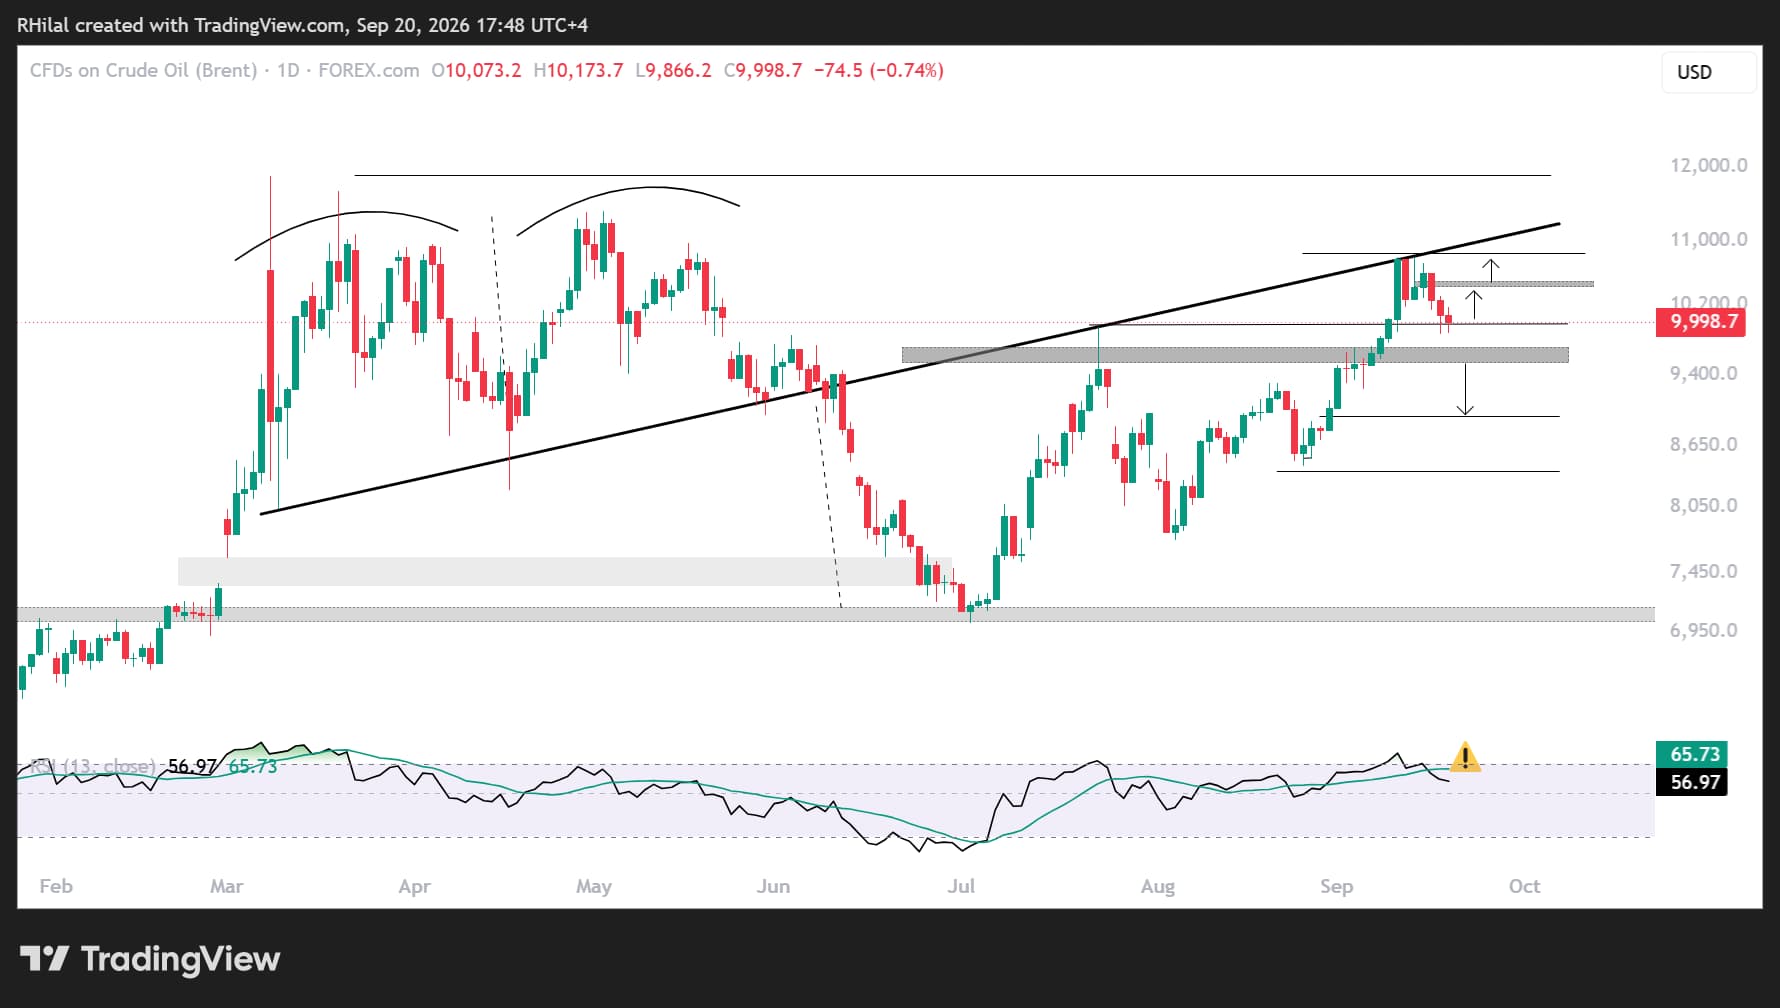
Brent Weekly Outlook — Log Scale
Source: TradingView
Similar to WTI, Brent crude has reached a major confluence zone, increasing the possibility that a short-term top may have formed.
The confluence zone includes:
- The 7-month trendline that served as support between March and June 2026 before turning into resistance between July and September 2026.
- The 78.6% Fibonacci retracement of the March–July 2026 downtrend near $108.
- Overbought momentum conditions last seen in March, close to the yearly highs.
The pullback was expected given the steepness of the rally and the importance of this confluence zone.
Bullish scenario: Reclaiming the $108 mark would restore the longer-term bullish outlook and reinforce inflationary and geopolitical escalation risks.
Such a move could redirect Brent toward the yearly highs.
Bearish scenario: A move back below the July 2026 high near $99 would support a short-term de-escalation narrative.
The next downside levels would be $95.70 and $93, corresponding to Fibonacci retracement levels of the advance between August 26 and September 11.
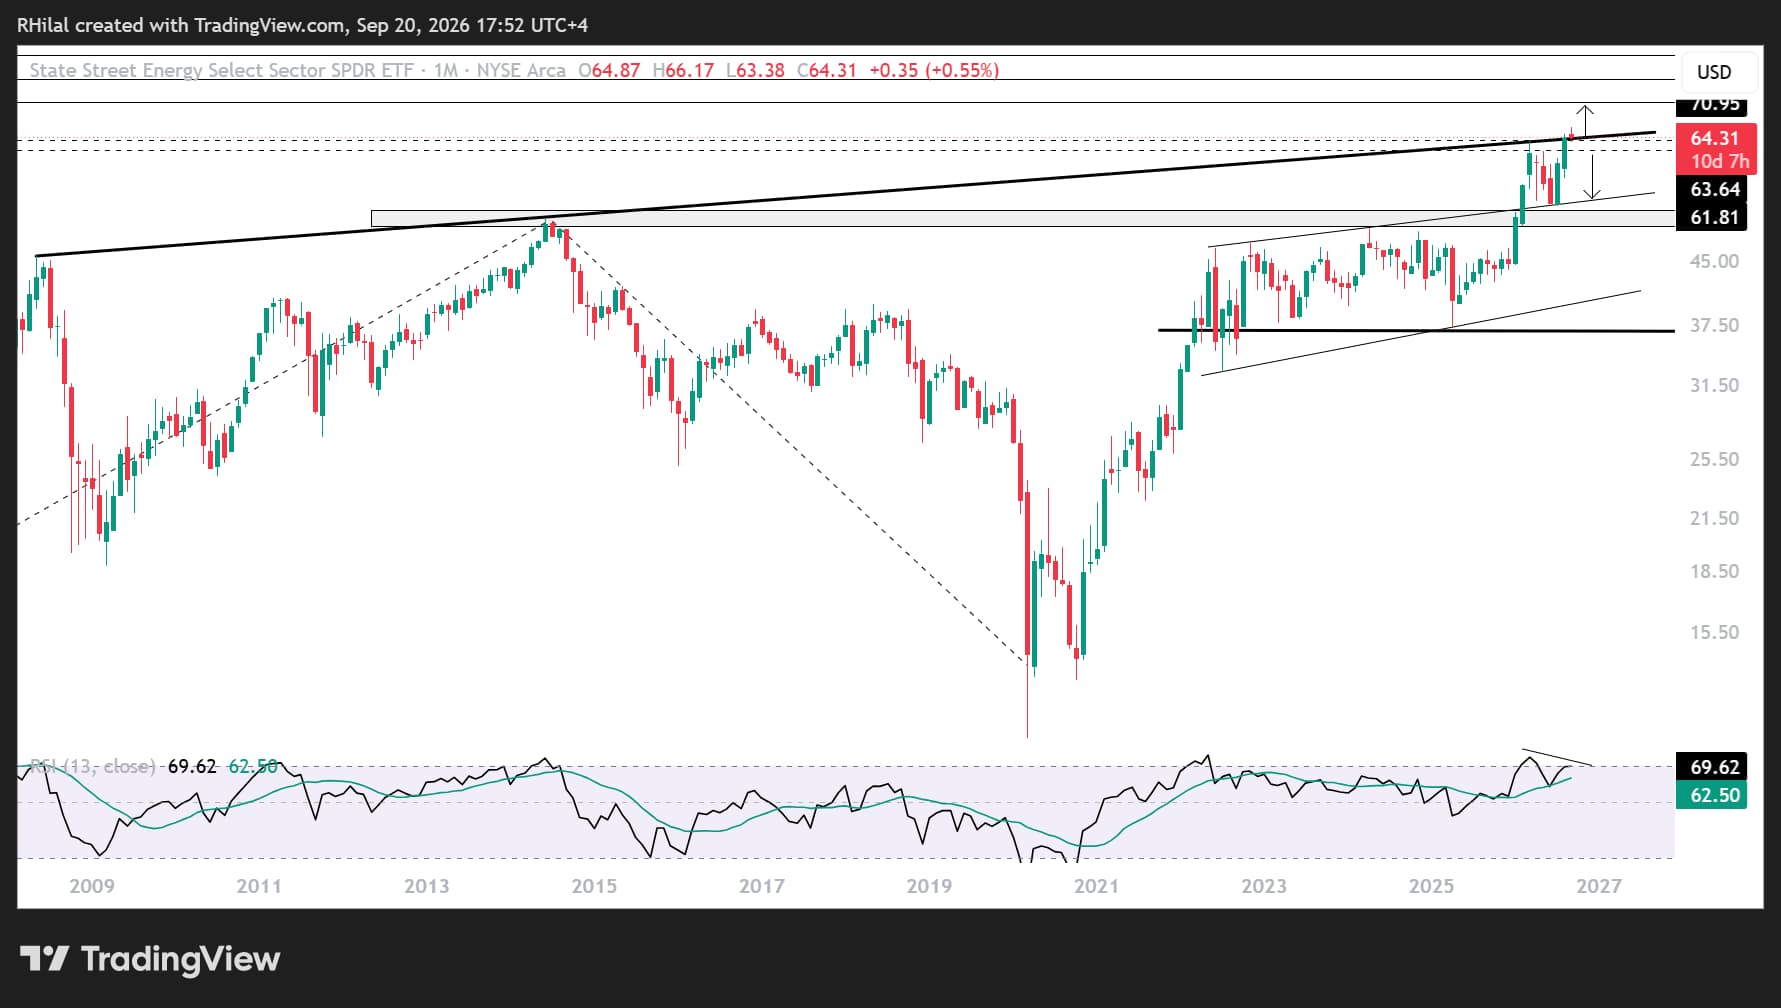
XLE Monthly Outlook — Log Scale
Source: TradingView
From an ETF perspective, XLE reflects the broader performance of the energy sector.
Price action broke above a major 2008–2026 resistance level, which turned into support in September 2026. For now, that support is holding above $63.50.
The price structure remains consistent with persistent geopolitical tensions and signals potential long-term stress across the energy market.
Bullish scenario: Holding above $63.50 and reclaiming the $65.50 area would reinforce the bullish forecast and open the door to new record highs.
Upside targets include the Fibonacci extension levels of the 2002–2014–2020 cycle near $68, $73 and $77.
This scenario would likely align with a broader escalation scenario.
Bearish scenario: A breakdown below the $61–$60 zone would reaffirm the strength of the multi-year resistance level and pressure XLE into another corrective cycle, targeting $58 and $51.
This scenario would likely align with broader de-escalation across geopolitical tensions.
Written by Razan Hilal, CMT
Follow on X: @Rh_waves
Latest market news




Open an account today
Experience award-winning platforms with fast and secure execution.
Economic calendar
Web Trader platform
Our sophisticated web-based platform is packed with features.
Related articles
USD/JPY Weekly Outlook: Yen Carry Unwind Risks Flash Red
A historic Nasdaq 100 selloff has revived fears of a disorderly yen carry trade unwind. Yet futures positioning, options pricing and Thanksgiving seasonality suggest the biggest threat to USD/JPY could come from the Fed itself.

Japanese Yen Forecast: USD/JPY Bulls Falter at Major Resistance—Critical Range Break in Focus 11 20 2026
USD/JPY’s latest retreat puts the September recovery under scrutiny, with nearby support offering bulls their next opportunity to respond.


Nasdaq 100, SOX: Tech rout may be a symptom of something far larger
The financial tide is going out, and some of the market's biggest winners are being hammered. Our research suggests there's more to the tech rout than the AI headlines.
From time to time, StoneX Financial Pty Ltd (“we”, “our”) website may contain links to other sites and/or resources provided by third parties. These links and/or resources are provided for your information only and we have no control over the contents of those materials, and in no way endorse their content. Any analysis, opinion, commentary or research-based material on our website is for information and educational purposes only and is not, in any circumstances, intended to be an offer, recommendation or solicitation to buy or sell. You should always seek independent advice as to your suitability to speculate in any related markets and your ability to assume the associated risks, if you are at all unsure. No representation or warranty is made, express or implied, that the materials on our website are complete or accurate. We are not under any obligation to update any such material.
As such, we (and/or our associated companies) will not be responsible or liable for any loss or damage incurred by you or any third party arising out of, or in connection with, any use of the information on our website (other than with regards to any duty or liability that we are unable to limit or exclude by law or under the applicable regulatory system) and any such liability is hereby expressly disclaimed.