



DAX and EUR/USD forecast: Lower energy prices, yields offer support
But the question, of course, is how much further oil prices and bond yields can fall. For now, the combination is supportive of risk assets and is helping to sustain a relatively benign decline in the dollar. The focus today will be on US core PCE inflation, due for release shortly, while Nvidia’s second-quarter earnings will provide another test for risk appetite after the US markets close – not just for US indices but for global tech-heavy indices given the influence Nvidia has over the global tech and AI names.
Share this:

Lower energy prices are providing a supportive environment for European markets, with the DAX extending its gains and the euro holding largely in a holding pattern. The decline in oil prices has also helped longer-dated US Treasuries, pushing yields lower as concerns over inflation have eased somewhat. But the question, of course, is how much further oil prices and bond yields can fall. For now, the combination is supportive of risk assets and is helping to sustain a relatively benign decline in the dollar. The focus today will be on US core PCE inflation, due for release shortly, while Nvidia’s second-quarter earnings will provide another test for risk appetite after the US markets close – not just for US indices but for global tech-heavy indices given the influence Nvidia has over the global tech and AI names. Attention then turns to Fed Chair Kevin Warsh and the Jackson Hole symposium on Friday.
DAX forecast: Softer energy supports risk appetite
It has now been a week after US Treasury Secretary Scott Bessent’s intervention in the Treasury market, longer-dated US yields are now around 10 basis points lower. The sharp decline in oil prices since last week has clearly played a role, helping to ease some of the market’s concerns about the inflation outlook.
Investors are also taking encouragement from the latest peace talks, brokered by Pakistan. Whether these discussions ultimately produce anything concrete remains to be seen, but for now they have helped to reduce some of the geopolitical risk premium embedded in the oil markets.
The next tests for the long end of the Treasury curve come in quick succession: today’s US PCE inflation report, tomorrow’s $44bn seven-year note auction and Friday’s Jackson Hole speech from Fed Chair Kevin Warsh.
Lower yields have already helped to keep the US dollar debasement trade relatively quiet so far this week. We haven’t seen any major upside follow through in gold, bitcoin or the euro yet.
But one thing that has continued is the continued grind higher in the DAX index, while Wall Street continues to consolidate.
DAX supported by lower energy prices and stronger eurozone data
Eurozone data continue to surprise on the upside, which is particularly surprising given the sharp rise in energy prices seen since the start of the year. The resilience of the European economy has been more impressive than many had expected. Some ECB policymakers such as Isabel Schnabel have acknowledged the improvement. For that reason, markets are still expecting to see a 25bp rate hike to 2.50% in September, while keeping alive the prospect of another 25bp increase early next year.
Still, that hasn’t stopped the DAX to keep chugging along. The German benchmark index found support right where it needed: at 25920/5 area, a level that was previously resistance earlier in the summer. The index held above the 21-day exponential average, too, and it has now broken above the next resistance levels of 26200ish. Next up is 26440ish and then the all-time high at 26581 will come into focus next, if the rally continues.
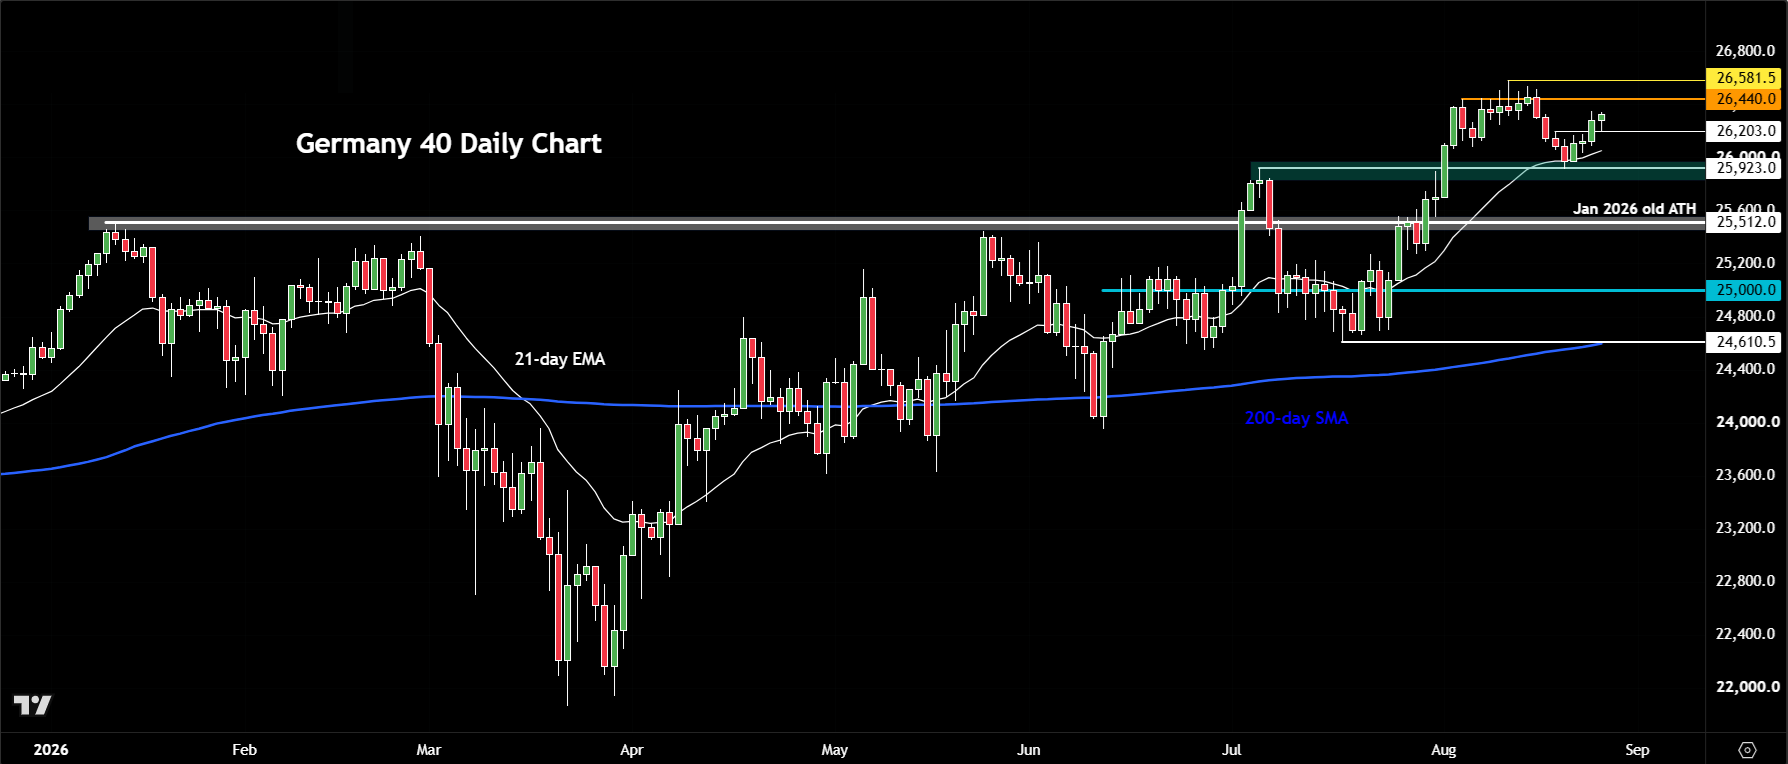
On the downside, below the support levels mentioned above, the next major level to watch is at 25500/15 area. This was the old record back in January, which was repeatedly tested and subsequently broke. Below that, 25K comes into focus.

Technical EUR/USD forecast and levels to watch
Assuming today’s US core PCE data do not deliver an upside surprise, or Warsh is not super hawkish on Friday, I continue to favour the EUR/USD holding the breakout we saw last week.
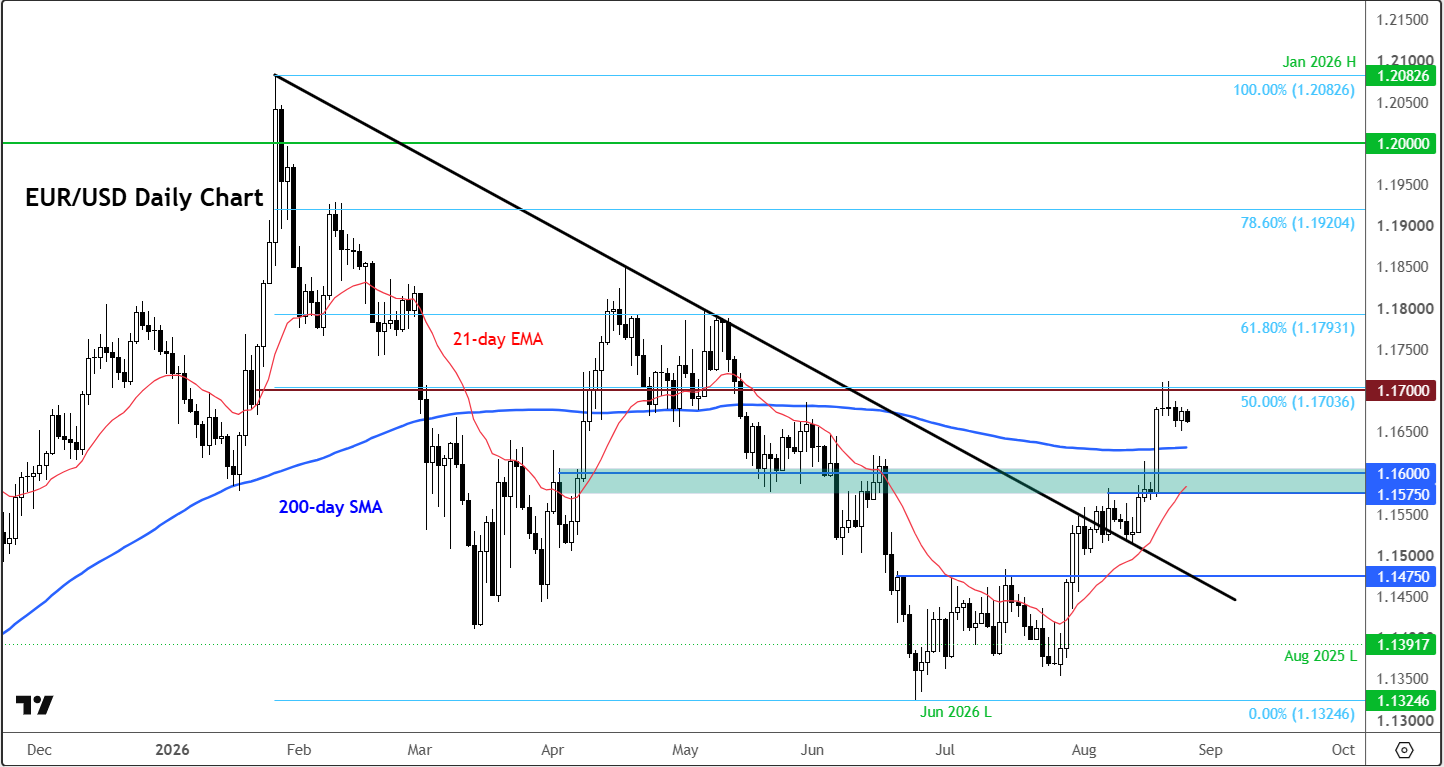
For now, the pair has eased back a tad after reaching its first major target around 1.1700, where the 50% retracement of the January-to-June decline comes into play. A modest pullback ahead of the Jackson Hole is hardly surprising.
On the downside, the 1.1575–1.1625 area is the most important support zone to watch in my view. The upper end of this range is where the 200-day moving average comes into play, while the lower end marks the origin of the recent breakout.
As long as EUR/USD holds above 1.1575/70 area, the technical bias remains bullish. A sustained move back below this level, however, would weaken the current bullish structure and raise the prospect that the breakout was ultimately a false one.
In terms of upside targets beyond 1.1700, the next level of resistance is seen 1.1800, where the 61.8% Fibonacci retracement of the January-to-June decline also sits.
What to expect from the PCE data?
For the dollar, a core PCE reading around 0.2% month-on-month would probably leave the currency relatively steady. But with the broader risk backdrop looking benign, the balance of risks may still favour modest dollar losses. That would certainly be the case, I think, if the PCE numbers come out weaker than expected.
It is also worth keeping an eye on the release of preliminary GDP, which is expected to have remained unchanged at 1.5% y/y from the Advance estimate.

Related tags:


Open an account today
Experience award-winning platforms with fast and secure execution.
Economic calendar
Web Trader platform
Our sophisticated web-based platform is packed with features.
Related articles
US Dollar Freight Train Drives EUR/USD, GBP/USD to Fresh Lows
A hawkish Fed and growing jitters around AI have pushed a continued rally in the Greenback, and there’s not yet an end in sight.

Japanese Yen Forecast: USD/JPY Bulls Falter at Major Resistance—Critical Range Break in Focus 11 20 2026
USD/JPY’s latest retreat puts the September recovery under scrutiny, with nearby support offering bulls their next opportunity to respond.


silver-crash-2026-vs-2011-collapse
Silver has collapsed some 65% from its January peak, drawing uncomfortable comparisons with the 2011 crash. The parallels are striking, but a bigger bubble, a hawkish Federal Reserve and years of supply deficits make this episode different.
From time to time, StoneX Financial Pty Ltd (“we”, “our”) website may contain links to other sites and/or resources provided by third parties. These links and/or resources are provided for your information only and we have no control over the contents of those materials, and in no way endorse their content. Any analysis, opinion, commentary or research-based material on our website is for information and educational purposes only and is not, in any circumstances, intended to be an offer, recommendation or solicitation to buy or sell. You should always seek independent advice as to your suitability to speculate in any related markets and your ability to assume the associated risks, if you are at all unsure. No representation or warranty is made, express or implied, that the materials on our website are complete or accurate. We are not under any obligation to update any such material.
As such, we (and/or our associated companies) will not be responsible or liable for any loss or damage incurred by you or any third party arising out of, or in connection with, any use of the information on our website (other than with regards to any duty or liability that we are unable to limit or exclude by law or under the applicable regulatory system) and any such liability is hereby expressly disclaimed.