



DAX forecast: Downside risks increased on re-escalation of US-Iran war
The markets should not ignore the economic impact of the closer of Strait of Hormuz, and failed peace talks at the weekend. Energy prices are going to remain elevated the longer this drags on, and this is particular bad news for European markets reliant on energy imports.
Share this:

Following the overnight gap-down, the major global indices managed to bounce off their lows, and in some cases quite impressively so. US markets even managed to turn positive momentarily as European indices clawed back further loss on the back of a NYP report that Iranian officials are studying abandoning uranium enrichment as a US condition for ending the war. This is not confirmed but markets sold oil and bought stocks as if the war was ending right away. We have seen this sort of price action in recent times, but one should be careful not to jump into any conclusions. The collapsed talks at the weekend, and Trump’s decision to escalate the situation again by announcing a blockade of their own of Iranian ports has gone into effect, which means there is a risk we could see a prolonged war. Against this backdrop, we maintain a cautious to slightly negative DAX forecast.
Prolonged Strait of Hormuz closure undermines DAX forecast
The markets should not ignore the economic impact of the closer of Strait of Hormuz, and failed peace talks at the weekend. Energy prices are going to remain elevated the longer this drags on, and this is particular bad news for European markets reliant on energy imports.
Iran’s effective shutdown has already driven energy prices higher. The US blockade is adding further upward pressure, while increasing the risk of escalation — particularly Iranian strikes on Gulf energy infrastructure.
The longer this drags on, the more economic and political pressure builds on Washington and its allies, strengthening Tehran’s hand. Removing roughly one fifth of global energy supply is no minor disruption.
Until now, the impact of this was masked by oil and gas already in transit. That cushion is now fading, and the real effects are beginning to bite. Petrol prices are just the start. Jet fuel shortages threaten air travel and Europe’s summer tourism season. Fertiliser shortages will push food prices higher.
Trump appears to be betting that economic strain on Iran will force it back down. That may prove optimistic. If the blockade fails, the US faces difficult choices. Even reopening the strait militarily would not guarantee safe passage. It would take only limited Iranian attacks to keep shipping risky — and effectively uninsurable.
So, it looks like the situation is unlikely to be resolved quickly. The economic fallout is only just beginning unfortunately. This should keep the DAX forecast cautious in the days and week ahead, unless we see one of the sides blinks and a major de-escalation follows.
Technical DAX forecast
The technical picture for the DAX shows the market trading within a wide range. The index is currently stuck between the 21-day exponential and the 200-day simple moving averages, which suggests there’s no clear trend or directional bias. In other words, this remains a level-to-level market. That makes sense given the ongoing uncertainty surrounding the Middle East situation.
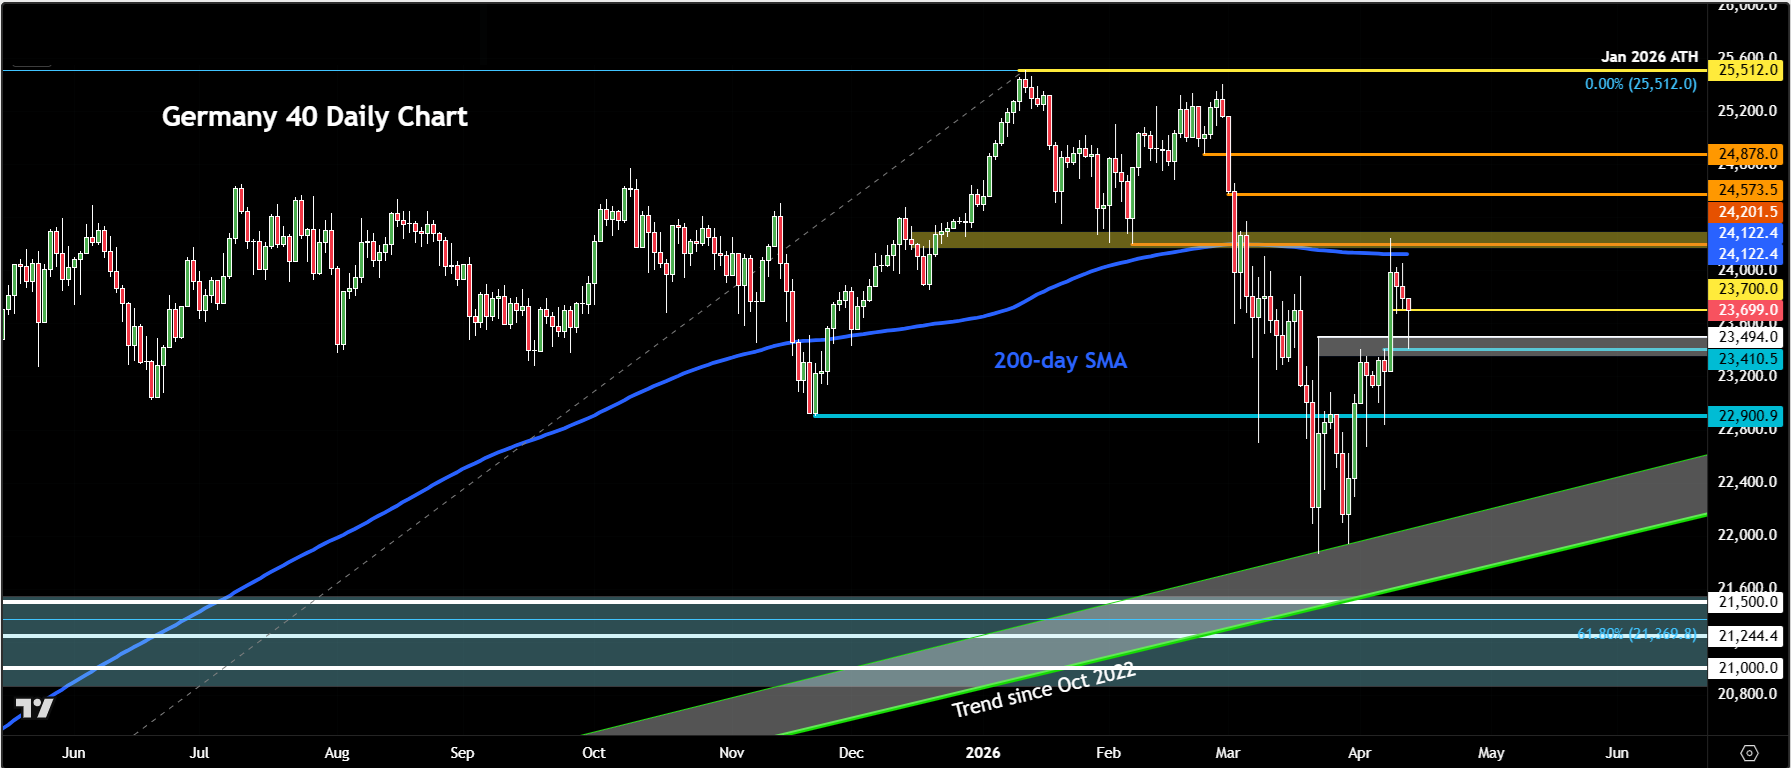
A couple of key levels to watch: 23,400 stands out as a major area. This was previously a strong resistance zone during the height of the Middle East conflict. It was broken during a sharp rally last Wednesday, and we’ve since retested it from above. So far, it’s holding.
Going forward, 23,400 is a critical level. A clean break below it could open the door for a move down towards 23,200 and 23,100, which are the next areas of support. Below that, 22,900 comes into focus — a very important level, as it marks the low from November 2025 and was reclaimed recently.
Make no mistake, 22,900 is the line in the sand. If the index breaks below this zone in the coming days, it would suggest a more bearish shift in market sentiment. However, if we continue to hold above it, there’s still a case that the market may have already formed a low during this period of geopolitical tension.
On the upside, resistance sits around 23,700, followed by the 24,000 level. Beyond that, the 200-day moving average at 24,125 is the next potential resistance zone.
So, there are clear levels on both sides of the market. This is a typical range environment — trade level to level and move on to the next opportunity.

-- Written by Fawad Razaqzada, Market Analyst
Follow Fawad on Twitter @Trader_F_R
Latest market news




Open an account today
Experience award-winning platforms with fast and secure execution.
Economic calendar
Web Trader platform
Our sophisticated web-based platform is packed with features.
Related articles
British Pound Short-term Outlook: GBP/USD 3% Plunge Hits 12-Month Low—Key Support in Focus 11 19 2026
Sterling’s October rebound has unraveled, leaving GBP/USD bears in control—but stretched momentum raises the stakes for the weekly close
Nasdaq 100 forecast: Markets turn jittery as Anthropic debuts at 34% above IPO
Nasdaq futures were up some 2% earlier, but shortly after the Anthropic debut, the index slumped to session lows, down more than 1.5%, before bouncing back from the lows at the time of writing. Much of the selling for the Nasdaq was driven by AMD which slumped nearly 10% after a Hunterbrook Media report raised fresh questions about the company’s exposure to US export controls on China.
Australian Dollar Technical Outlook: AUD/USD 6% Plunge Tests Make-or-Break Support at Yearly Low 11 19 2026
AUD/USD’s four-week decline is testing critical support, with a decisive break below this threshold needed to fuel the next major leg lower.
From time to time, StoneX Financial Pty Ltd (“we”, “our”) website may contain links to other sites and/or resources provided by third parties. These links and/or resources are provided for your information only and we have no control over the contents of those materials, and in no way endorse their content. Any analysis, opinion, commentary or research-based material on our website is for information and educational purposes only and is not, in any circumstances, intended to be an offer, recommendation or solicitation to buy or sell. You should always seek independent advice as to your suitability to speculate in any related markets and your ability to assume the associated risks, if you are at all unsure. No representation or warranty is made, express or implied, that the materials on our website are complete or accurate. We are not under any obligation to update any such material.
As such, we (and/or our associated companies) will not be responsible or liable for any loss or damage incurred by you or any third party arising out of, or in connection with, any use of the information on our website (other than with regards to any duty or liability that we are unable to limit or exclude by law or under the applicable regulatory system) and any such liability is hereby expressly disclaimed.