





EUR/USD Surges in Asia as the USD Continues to Unravel
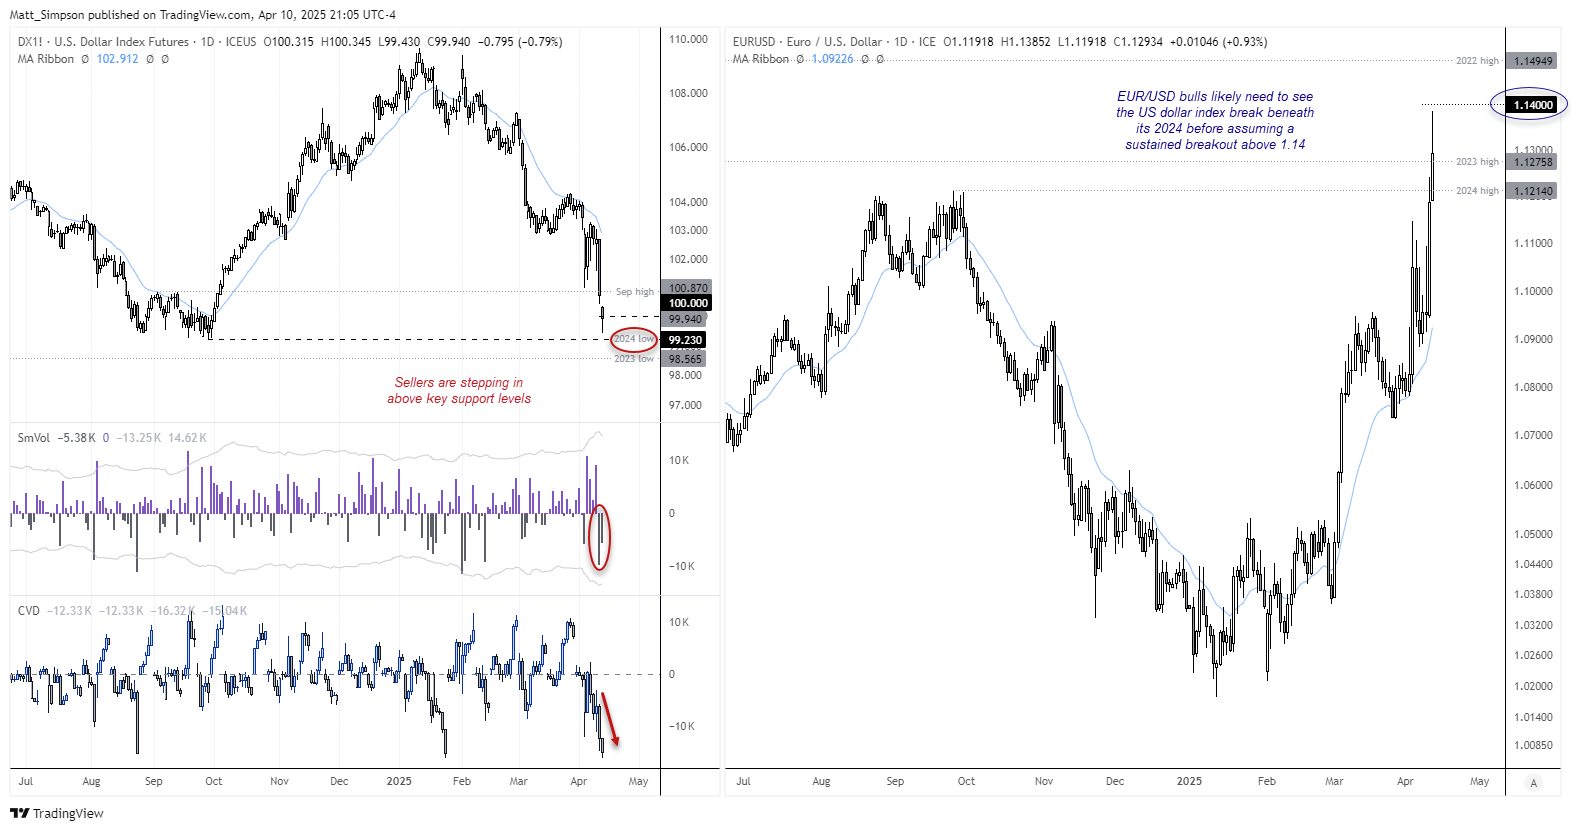
EUR/USD came close to tapping the 114 handle within minutes of cutting through 113 during thin Asian trade. Traders should keep an eye on the 30-year bond yield around 5% and the US dollar index around the 2024 low to assess the euros likelihood of a sustained breakout.
Share this:

View related analysis:
- USD/CHF Hurled Overboard, Swiss Franc, Gold Remain Supreme
- CHF Beats Yen for Safety as Tariffs Take Second Quarter to the Slaughter
- AUD/USD, Nasdaq Soar as Trump Blinks First, Sparking Epic Market U-Turn
- AUD/USD Analysis: Eyes on China and the yuan Amid Trump’s 104% Tariff
View related analysis:
- USD/CHF Hurled Overboard, Swiss Franc, Gold Remain Supreme
- CHF Beats Yen for Safety as Tariffs Take Second Quarter to the Slaughter
- AUD/USD, Nasdaq Soar as Trump Blinks First, Sparking Epic Market U-Turn
- AUD/USD Analysis: Eyes on China and the yuan Amid Trump’s 104% Tariff
Anyone expecting a quiet Asian session heading into the weekend was caught off guard as the US dollar continued to unravel at breakneck speed.
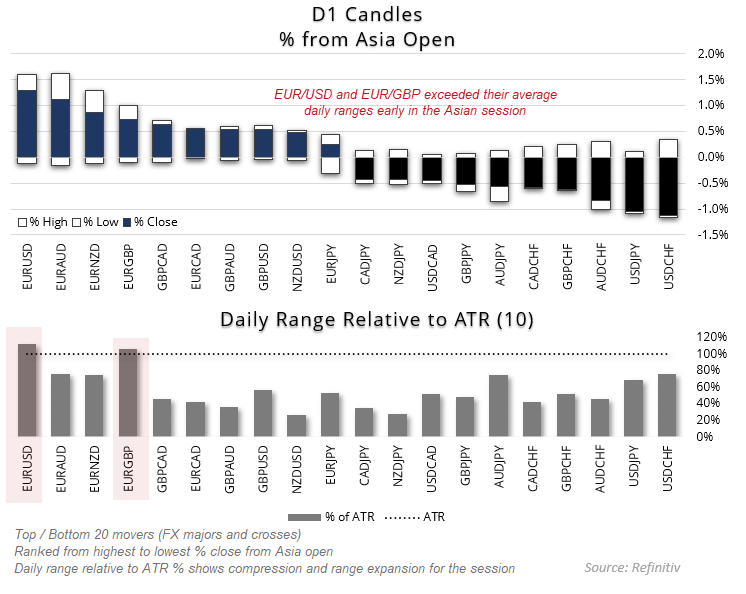
US dollar index futures gapped lower at Friday’s open and swiftly fell below the 100 handle, a key level it remains beneath as of writing. Volatility in the British pound was also elevated, leading to EUR/USD and EUR/GBP exceeding their daily ranges early in the Asian session—a rare occurrence indeed.
EUR/USD, US Dollar Index Analysis
How the US dollar index behaves around the 100 handle and the 2024 low is crucial in determining whether we will see a sustained move above 1.14 for EUR/USD. My sense at the moment is that, given the large moves in lower liquidity conditions, the US dollar index may be prone to a bounce after a shakeout. This would leave EUR/USD vulnerable to a pullback beneath its 2023 and 2024 highs.
Keep an Eye on US Bond Yields
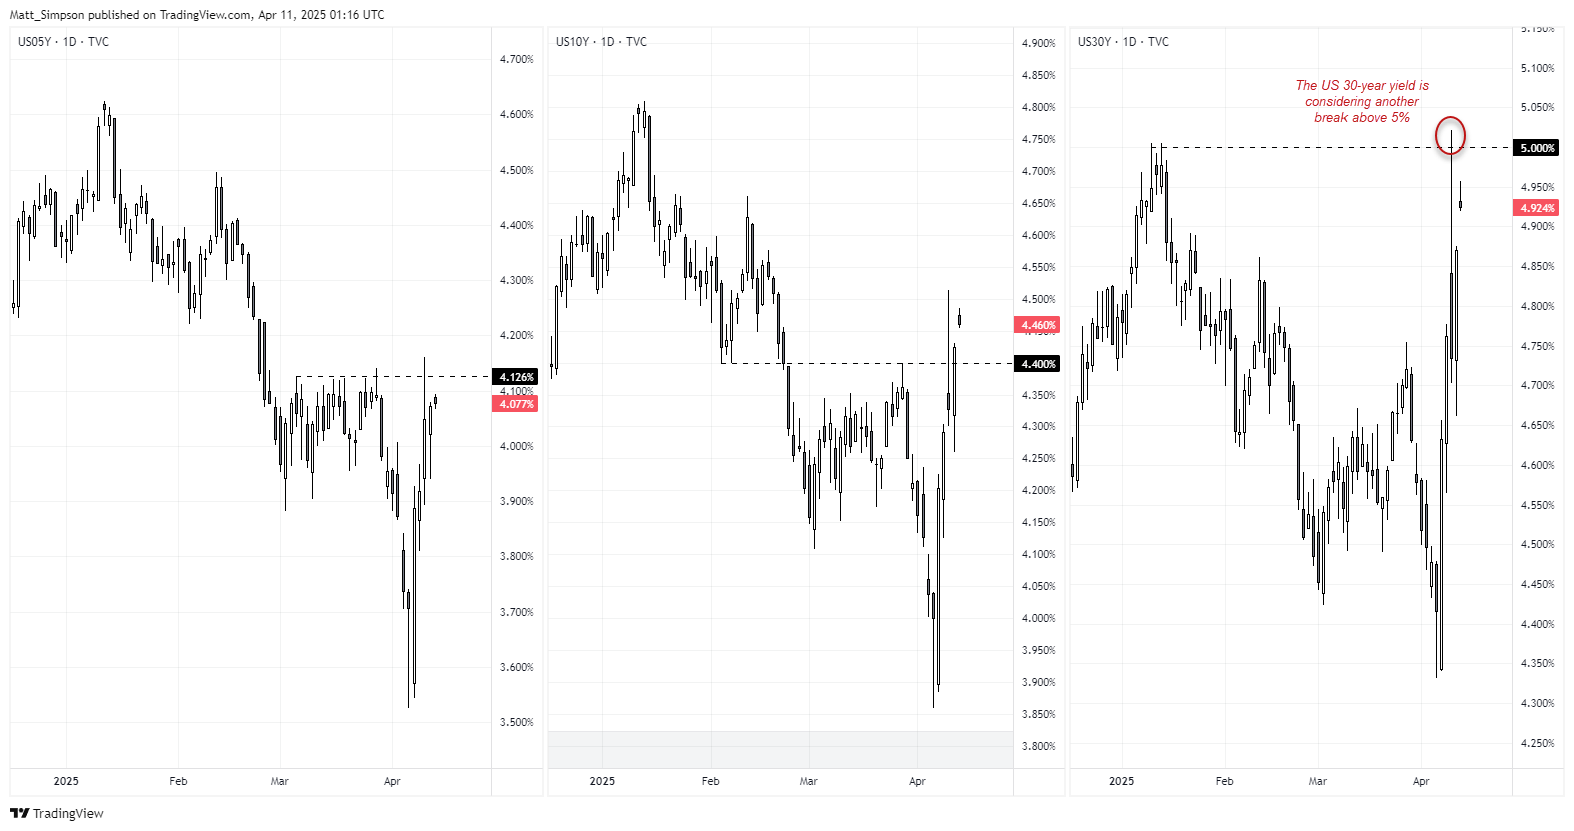
Another key market to monitor is, of course, the bond market. Bond prices are under pressure as investors stampede for the exit, pushing US bond yields higher as they demand a larger premium for holding the supposed safe haven. The US 10-year has surged to 4.5%, but if there’s a level likely to break the camel's back, it’s 5% on the US 30-year.
On Wednesday, we saw the 30-year briefly spike above 5% in the Asian session, and within 15 hours, President Trump had caved, providing a 90-day pause for his aggressive tariffs. But with the pause already in motion and bond yields rising once more in the Asian session, it seems the effect of the pause is quickly fading.
-- Written by Matt Simpson
Follow Matt on Twitter @cLeverEdge
How to trade with City Index
You can trade with City Index by following these four easy steps:
- Open an account, or log in if you’re already a customer
• Open an account in the UK
• Open an account in Australia
• Open an account in Singapore
- Search for the market you want to trade in our award-winning platform
- Choose your position and size, and your stop and limit levels
- Place the trade
Related tags:



Open an account today
Experience award-winning platforms with fast and secure execution.
Economic calendar
Web Trader platform
Our sophisticated web-based platform is packed with features.
Related articles

US Dollar Freight Train Drives EUR/USD, GBP/USD to Fresh Lows
A hawkish Fed and growing jitters around AI have pushed a continued rally in the Greenback, and there’s not yet an end in sight.


Japanese Yen Forecast: USD/JPY Bulls Falter at Major Resistance—Critical Range Break in Focus 11 20 2026
USD/JPY’s latest retreat puts the September recovery under scrutiny, with nearby support offering bulls their next opportunity to respond.

silver-crash-2026-vs-2011-collapse
Silver has collapsed some 65% from its January peak, drawing uncomfortable comparisons with the 2011 crash. The parallels are striking, but a bigger bubble, a hawkish Federal Reserve and years of supply deficits make this episode different.

From time to time, StoneX Financial Pty Ltd (“we”, “our”) website may contain links to other sites and/or resources provided by third parties. These links and/or resources are provided for your information only and we have no control over the contents of those materials, and in no way endorse their content. Any analysis, opinion, commentary or research-based material on our website is for information and educational purposes only and is not, in any circumstances, intended to be an offer, recommendation or solicitation to buy or sell. You should always seek independent advice as to your suitability to speculate in any related markets and your ability to assume the associated risks, if you are at all unsure. No representation or warranty is made, express or implied, that the materials on our website are complete or accurate. We are not under any obligation to update any such material.
As such, we (and/or our associated companies) will not be responsible or liable for any loss or damage incurred by you or any third party arising out of, or in connection with, any use of the information on our website (other than with regards to any duty or liability that we are unable to limit or exclude by law or under the applicable regulatory system) and any such liability is hereby expressly disclaimed.