



Euro Technical Analysis: EUR/USD, EUR/JPY, EUR/AUD
EUR/USD rebounds from 1.15, EUR/JPY stalls below 186 and EUR/AUD eyes fresh gains after a bullish range expansion.
Share this:

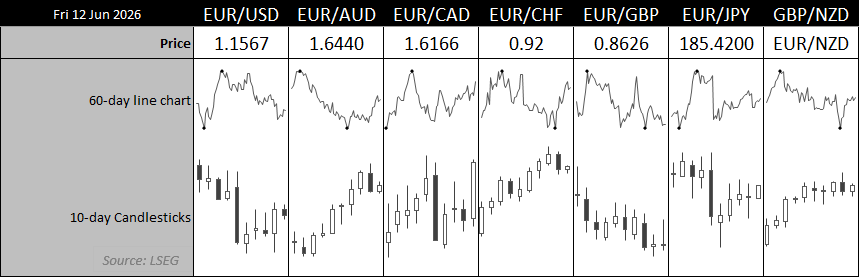
The euro is showing mixed performance across major crosses. EUR/USD is attempting to recover from key support at 1.15 as US dollar weakness persists, EUR/JPY is struggling to regain momentum beneath 186, and EUR/AUD remains constructive despite signs of a near-term pullback. Yet with the exception of the Australian dollar, I suspect the euro will struggle to regain upside momentum against the US dollar and Japanese yen in the coming weeks.
Source: LSEG
View related analysis:
View related analysis:
Euro Forecast: EUR/USD, EUR/JPY and EUR/AUD Technical Outlook
EUR/USD Rebounds From 1.15 as Dollar Weakness Persists – For now
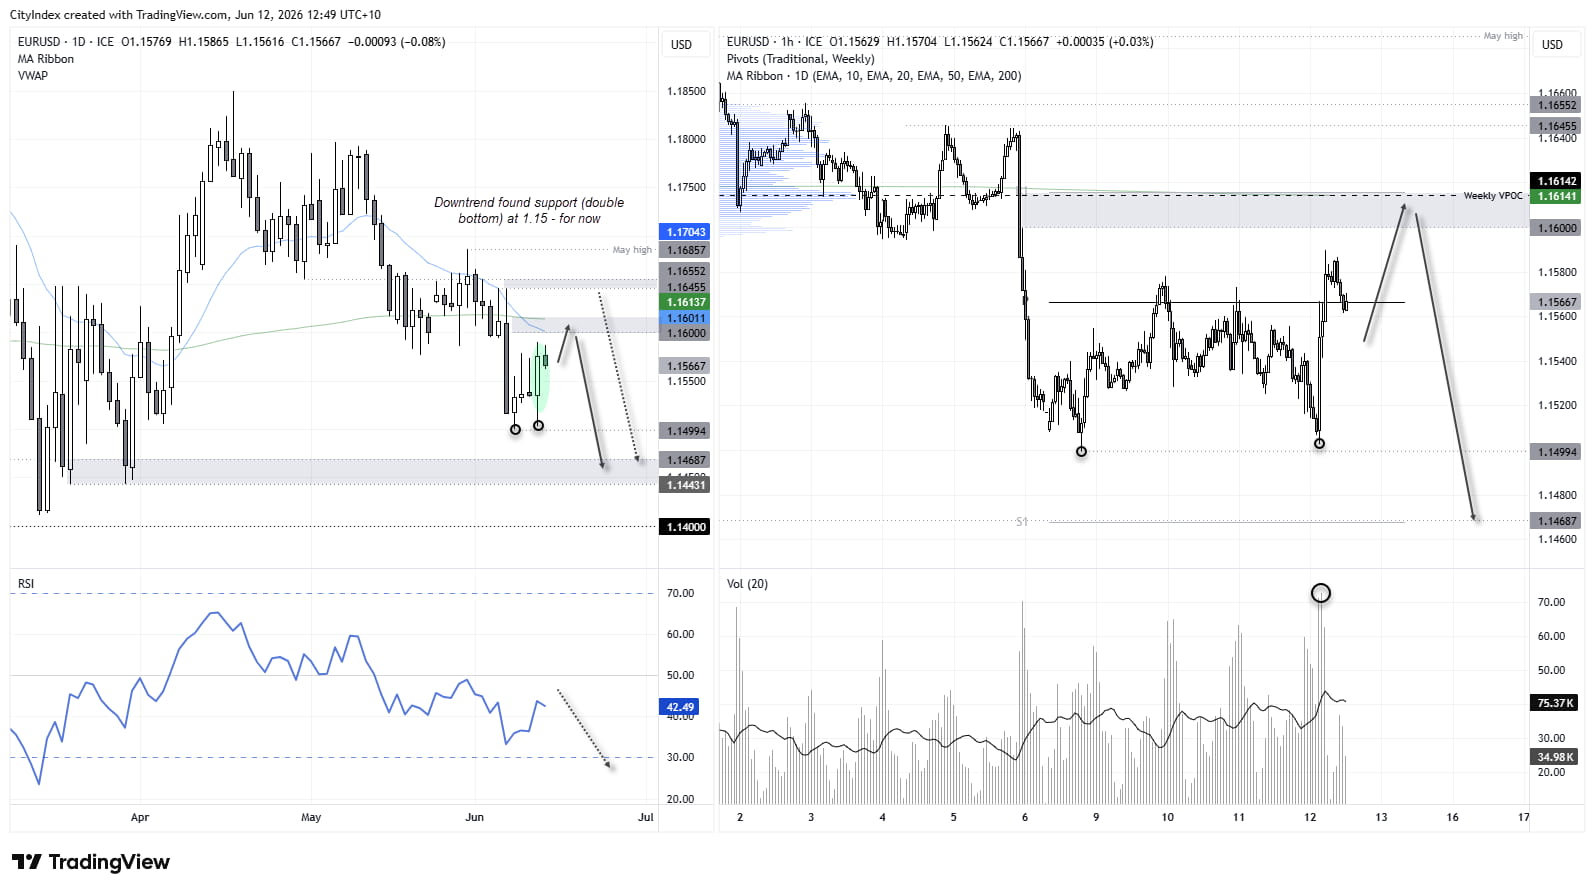
The euro has clearly been in a downtrend on the daily chart since the April high, marked by a series of lower lows and lower highs. However, bulls are fighting back, with a double bottom forming around the 1.15 handle and a bullish engulfing candle on Thursday.
The weaker US dollar has been the dominant driver, although for EUR/USD to sustain its rally we likely need an improvement in risk sentiment and continued pressure on the greenback. Yet conflicting headlines have already undermined claims that a Middle East peace deal is imminent, leaving scope for the US dollar to strengthen and weigh on EUR/USD heading into next week.
The 1-hour chart shows a strong rebound from 1.15 alongside a surge in volumes to suggest bullish initiation. While prices are retracing lower, I suspect bulls will be seeking dips in later sessions, which could bring 1.16 into view for bulls.
Note the 200-day EMA and a prior weekly VPOC overhead near 1.6100 as potential resistance, while the 20-day EMA continues to point lower in line with the broader downtrend. EUR/USD needs to break above the May high (1.1656) to invalidate the bearish trend on the daily chart. Therefore, bears may seek to fade rallies towards the 200-day EMA or the 1.1650 area in anticipation of a move back below 1.15.
Source: ICE, TradingView


EUR/JPY Technical Analysis: Euro vs Japanese Yen
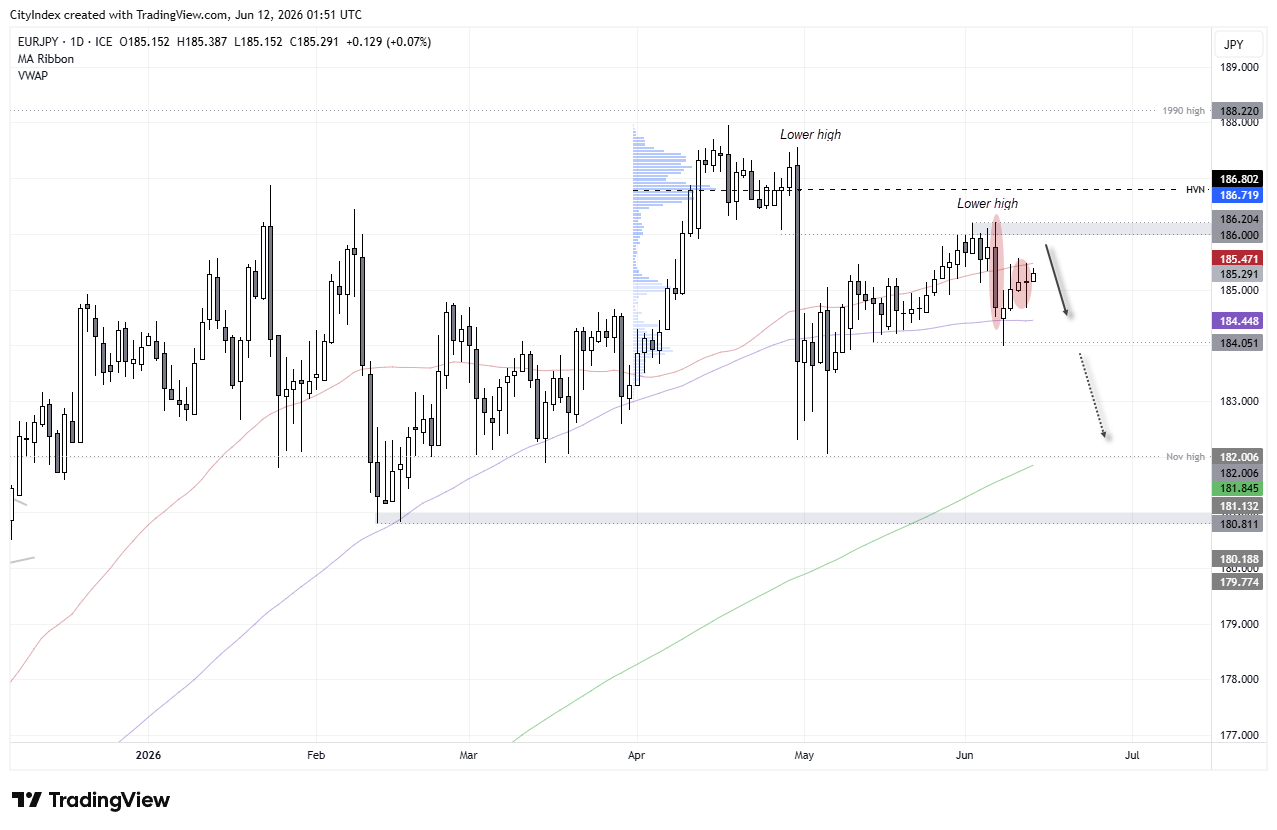
I am closely watching EUR/JPY for signs that the euro-yen cross is forming a swing high. The bearish engulfing candle on June 5 marked its most bearish and volatile day in 22 sessions and set a lower high relative to April's peak. Repeated failures to close above 186 preceded the latest downturn, while the subsequent rebound has so far struggled to reclaim 185 decisively. The emergence of a small shooting star and rikshaw man doji points to waning bullish momentum and increases the likelihood of another lower high.
However, for now, EUR/JPY is stuck between the 50-day and 100-day EMAs. Perhaps we'll need to wait for next week's BOJ interest rate decision or potential intervention from the MOF before momentum really takes off. Clearly, intervention would be the most bearish outcome for EUR/JPY, given the cross plunged more than 500 pips on April 30. Yet if the MOF stands pat and the BOJ does not deliver a hawkish surprise, EUR/JPY could continue to drift higher.
Source: ICE, TradingView
- Bears could look to fade low-volatility moves towards 186 in anticipation of the next leg lower in EUR/JPY.
- A break beneath 184 brings 183 and 182 into focus for bears.
- A break above 186.2 brings the high-volume node (HVN) at 186.8 into focus for bulls.
EUR/AUD Technical Analysis: Euro vs Australian Dollar
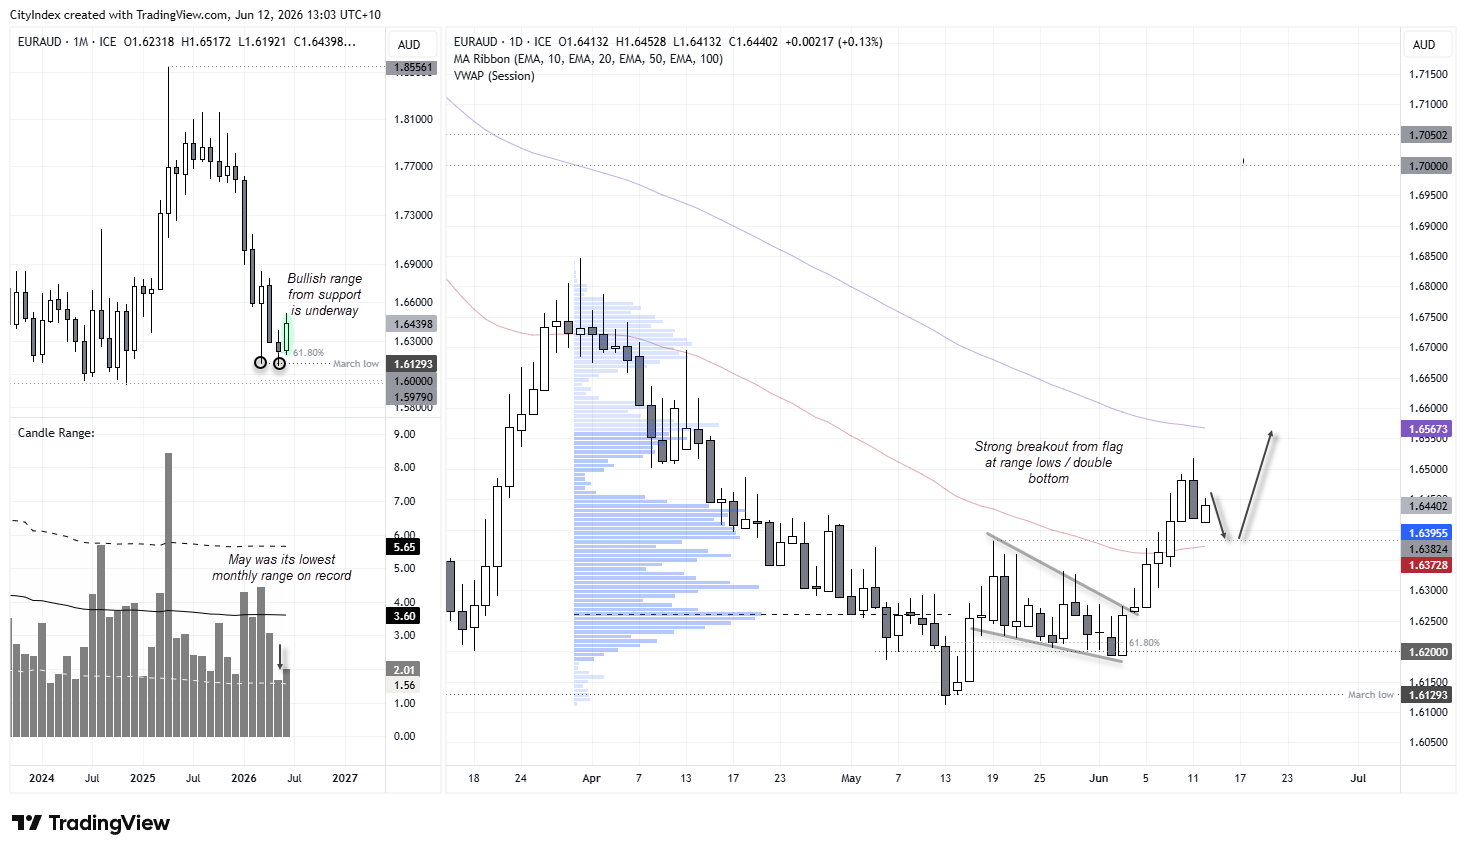
I outlined my bullish bias on EUR/AUD a couple of weeks ago, so I am pleased to see it has played out nicely. I noted that May's candle had the smallest monthly range on record, and with EUR/AUD holding above several clustered support levels, I expected bullish range expansion to take hold. It did not disappoint.
EUR/AUD rallied 2% over a six-day period and exceeded my 1.6400 target, although a bearish reversal pattern now warns of a retracement.
A dark cloud cover pattern shows EUR/AUD failed to hold above 1.6500, which hints at a pullback towards the 1.6382 high and 50-day EMA. However, given the strength of the bullish range expansion from recent lows, I suspect bulls may be waiting to buy such dips and are ultimately targeting a move towards 1.66, near the 100-day EMA.
Source: ICE, TradingView
View the full economic calendar
View the full economic calendar
-- Written by Matt Simpson
Follow Matt on Twitter @cLeverEdge
How to trade with City Index
You can trade with City Index by following these four easy steps:
- Open an account, or log in if you’re already a customer
• Open an account in the UK
• Open an account in Australia
• Open an account in Singapore
- Search for the market you want to trade in our award-winning platform
- Choose your position and size, and your stop and limit levels
- Place the trade



Open an account today
Experience award-winning platforms with fast and secure execution.
Economic calendar
Web Trader platform
Our sophisticated web-based platform is packed with features.
Related articles

US Dollar Freight Train Drives EUR/USD, GBP/USD to Fresh Lows
A hawkish Fed and growing jitters around AI have pushed a continued rally in the Greenback, and there’s not yet an end in sight.


Japanese Yen Forecast: USD/JPY Bulls Falter at Major Resistance—Critical Range Break in Focus 11 20 2026
USD/JPY’s latest retreat puts the September recovery under scrutiny, with nearby support offering bulls their next opportunity to respond.

silver-crash-2026-vs-2011-collapse
Silver has collapsed some 65% from its January peak, drawing uncomfortable comparisons with the 2011 crash. The parallels are striking, but a bigger bubble, a hawkish Federal Reserve and years of supply deficits make this episode different.

From time to time, StoneX Financial Pty Ltd (“we”, “our”) website may contain links to other sites and/or resources provided by third parties. These links and/or resources are provided for your information only and we have no control over the contents of those materials, and in no way endorse their content. Any analysis, opinion, commentary or research-based material on our website is for information and educational purposes only and is not, in any circumstances, intended to be an offer, recommendation or solicitation to buy or sell. You should always seek independent advice as to your suitability to speculate in any related markets and your ability to assume the associated risks, if you are at all unsure. No representation or warranty is made, express or implied, that the materials on our website are complete or accurate. We are not under any obligation to update any such material.
As such, we (and/or our associated companies) will not be responsible or liable for any loss or damage incurred by you or any third party arising out of, or in connection with, any use of the information on our website (other than with regards to any duty or liability that we are unable to limit or exclude by law or under the applicable regulatory system) and any such liability is hereby expressly disclaimed.