





GBP/USD Trades Below 200-Day SMA for First Time Since May
GBP/USD appears to be on track to test the June low (1.2613) as it no longer tracks the positive slope in the 200-Day SMA (1.2820).
Share this:

British Pound Forecast: GBP/USD
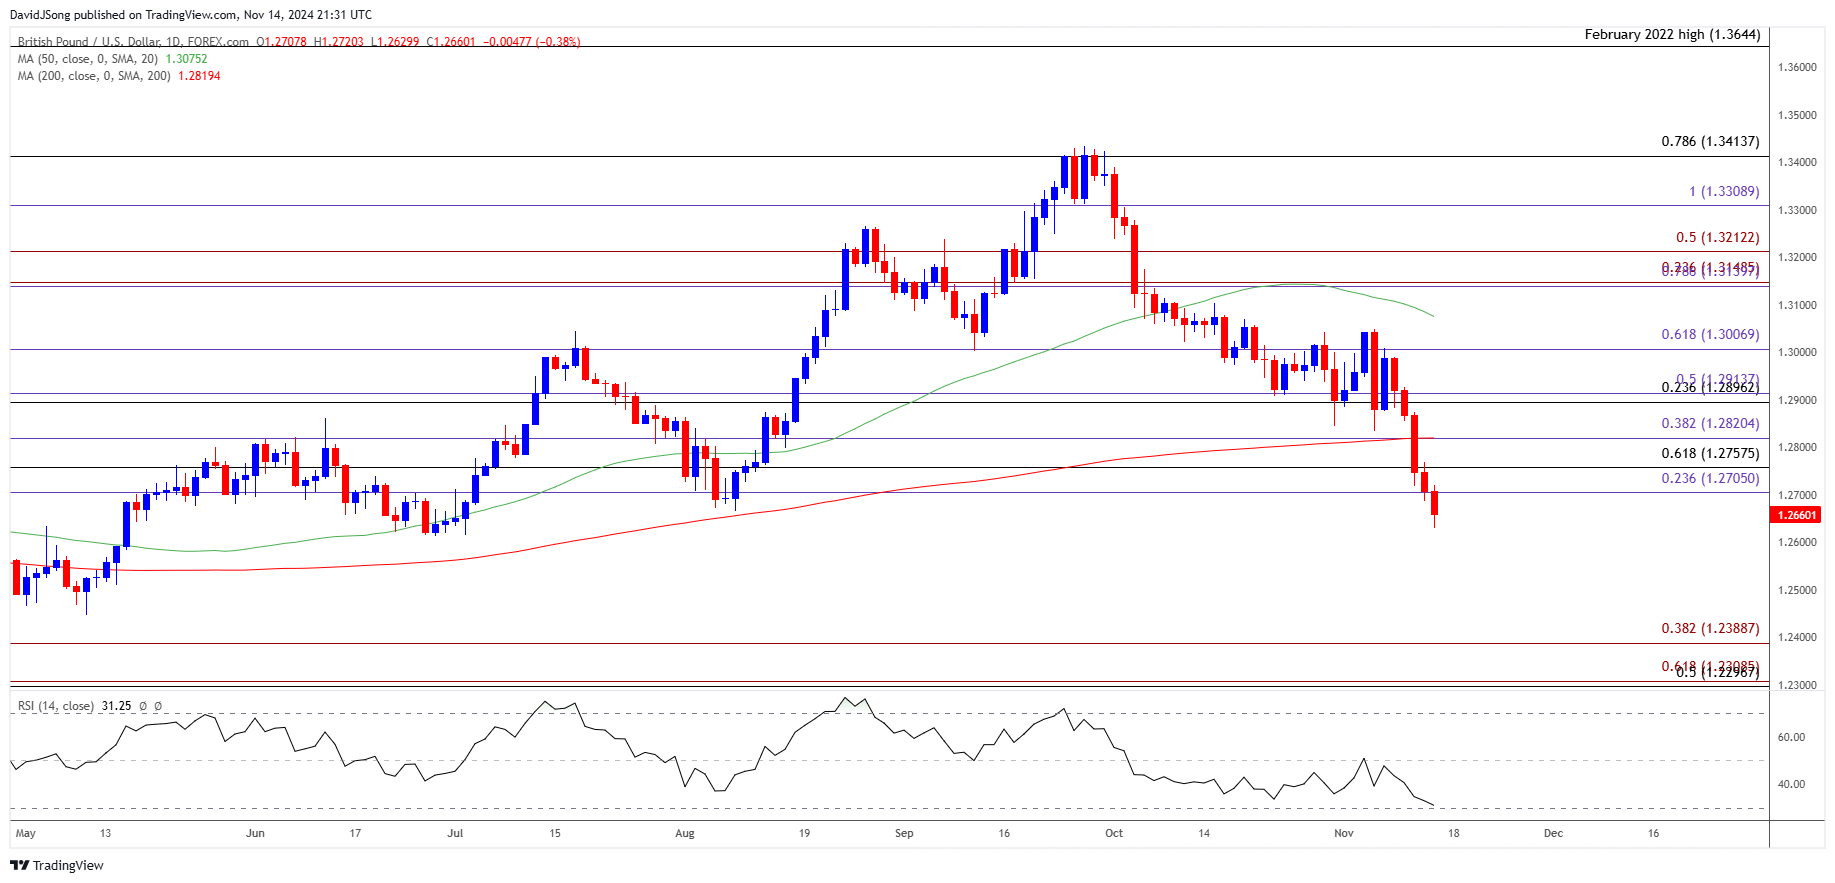
GBP/USD continues to carve a series of lower highs and lows after failing to hold within the opening range for November, and the exchange rate appears to be on track to test the June low (1.2613) as it no longer tracks the positive slope in the 200-Day SMA (1.2820).
GBP/USD Trades Below 200-Day SMA for First Time Since May
The bearish price series in GBP/USD may persist as it trades below the long-term moving average for the first time May, and a further decline in the exchange rate may push the Relative Strength Index (RSI) into oversold territory for the first time since April.
Join David Song for the Weekly Fundamental Market Outlook webinar. David provides a market overview and takes questions in real-time. Register Here
At the same time, lack of momentum to test the June low (1.2613) may keep the RSI above 30, but the US Retail Sales report may sway GBP/USD as the update is anticipated to show another rise in consumer spending.
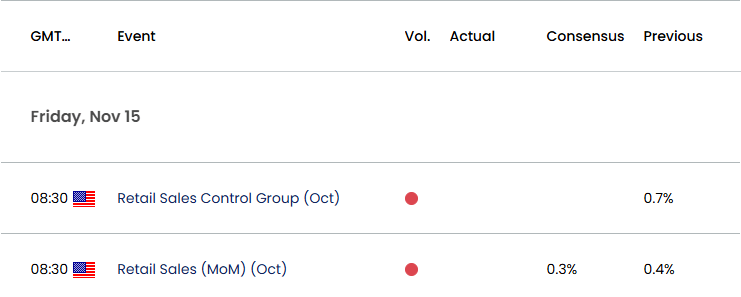
US Economic Calendar
US Retail Sales are projected to increase 0.3% in October after climbing 0.4% the month prior, and a positive development may push the Federal Reserve to the sidelines following the 25bp rate-cut at the November meeting.
In turn, waning expectations for another Fed rate-cut may fuel the recent selloff in GBP/USD, but a dismal Retail Sales report may produce headwinds for the US Dollar as it encourages the Federal Open Market Committee (FOMC) to further unwind its restrictive policy.
With that said, GBP/USD may attempt to retrace the decline from the start of the week if it struggles to test the June low (1.2613), but a move below 30 in the RSI is likely to be accompanied by a further decline in the exchange rate like the price action from earlier this year.
GBP/USD Price Chart –Daily
Chart Prepared by David Song, Strategist; GBP/USD on TradingView
- GBP/USD trades to a fresh monthly low (1.2630) as it falls for the fifth consecutive day, with a breach below the June low (1.2613) raising the scope for a move towards the May low (1.2446).
- Next area of interest comes in around 1.2300 (50% Fibonacci retracement) to 1.2390 (38.2% Fibonacci extension), which incorporates the yearly low (1.2300) but failure to test the June low (1.2613) may curb the recent series of lower highs and lows.
- Need a move back above the 1.2710 (23.6% Fibonacci extension) to 1.2760 (61.8% Fibonacci retracement) region for GBP/USD to snap the bearish price series, with a move above 1.2820 (38.2% Fibonacci extension) bringing the 1.2900 (23.6% Fibonacci retracement) to 1.2910 (50% Fibonacci extension) zone back on the radar.
Additional Market Outlooks
EUR/USD Eyes 2023 Low as RSI Flirts with Oversold Zone
Gold Price Outlook Mired by Close Below 50-Day SMA
AUD/USD Vulnerable amid Break Below November Opening Range
US Dollar Forecast: USD/CAD on Cusp of Testing 2022 High
--- Written by David Song, Senior Strategist
Follow on Twitter at @DavidJSong
Related tags:



Open an account today
Experience award-winning platforms with fast and secure execution.
Economic calendar
Web Trader platform
Our sophisticated web-based platform is packed with features.
Related articles
Nasdaq 100, SOX: Tech rout may be a symptom of something far larger
The financial tide is going out, and some of the market's biggest winners are being hammered. Our research suggests there's more to the tech rout than the AI headlines.

British Pound Short-term Outlook: GBP/USD 3% Plunge Hits 12-Month Low—Key Support in Focus 11 19 2026
Sterling’s October rebound has unraveled, leaving GBP/USD bears in control—but stretched momentum raises the stakes for the weekly close


Nasdaq 100 forecast: Markets turn jittery as Anthropic debuts at 34% above IPO
Nasdaq futures were up some 2% earlier, but shortly after the Anthropic debut, the index slumped to session lows, down more than 1.5%, before bouncing back from the lows at the time of writing. Much of the selling for the Nasdaq was driven by AMD which slumped nearly 10% after a Hunterbrook Media report raised fresh questions about the company’s exposure to US export controls on China.

From time to time, StoneX Financial Pty Ltd (“we”, “our”) website may contain links to other sites and/or resources provided by third parties. These links and/or resources are provided for your information only and we have no control over the contents of those materials, and in no way endorse their content. Any analysis, opinion, commentary or research-based material on our website is for information and educational purposes only and is not, in any circumstances, intended to be an offer, recommendation or solicitation to buy or sell. You should always seek independent advice as to your suitability to speculate in any related markets and your ability to assume the associated risks, if you are at all unsure. No representation or warranty is made, express or implied, that the materials on our website are complete or accurate. We are not under any obligation to update any such material.
As such, we (and/or our associated companies) will not be responsible or liable for any loss or damage incurred by you or any third party arising out of, or in connection with, any use of the information on our website (other than with regards to any duty or liability that we are unable to limit or exclude by law or under the applicable regulatory system) and any such liability is hereby expressly disclaimed.