


Gold Analysis: XAU/USD Remains Neutral Ahead of Fed Minutes
As the week unfolds, gold dynamics have been defined by prolonged consolidation. Over the last 5 sessions, XAU/USD has barely registered an average variation of 1.00%, lacking clear direction and cementing a strong neutral bias.
Share this:

As the week unfolds, gold dynamics have been defined by prolonged consolidation. Over the last 5 sessions, XAU/USD has barely registered an average variation of 1.00%, lacking clear direction and cementing a strong neutral bias. This behavior contrasts with previous weeks, where the precious metal saw swings exceeding 3.00%. This new sideways phase is largely due to the ceiling gold has hit amid sustained bond market behavior and the wait for the Federal Reserve minutes, which could impact its substitute markets. Unless a heavier fundamental catalyst emerges, this indecision is likely to continue dominating price action in the short term.


What to Expect from the Federal Reserve Minutes?
Tomorrow, the US central bank will release its meeting minutes, an event where the market will look for details on the latest policy discussions. Investors will closely scrutinize whether several members considered raising interest rates or just how concerned the Fed is about inflationary pressures stemming from energy prices.
Currently, the CMEGROUP probability tool reflects a 65% chance that the benchmark rate will hold steady at 3.75% during the September 16 decision. Furthermore, there is over a 50% probability that this same pause scenario will repeat at the late-October meeting. This suggests the market is pricing in a cautious Federal Reserve in the near term. However, this expectation could shift if the minutes reveal heightened concerns over inflation and if a significant number of members lean toward evaluating future rate hikes.
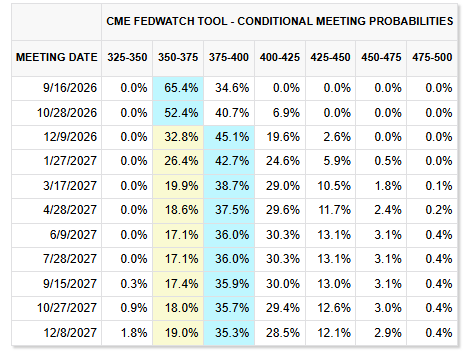
Source: CMEGROUP
This event is crucial for the US 10-year Treasury bond market, one of the main substitute assets for gold. Despite expectations of a monetary pause, yields remain above the 4.7% zone, near their 2026 highs, cementing the appeal of these instruments over the precious metal.
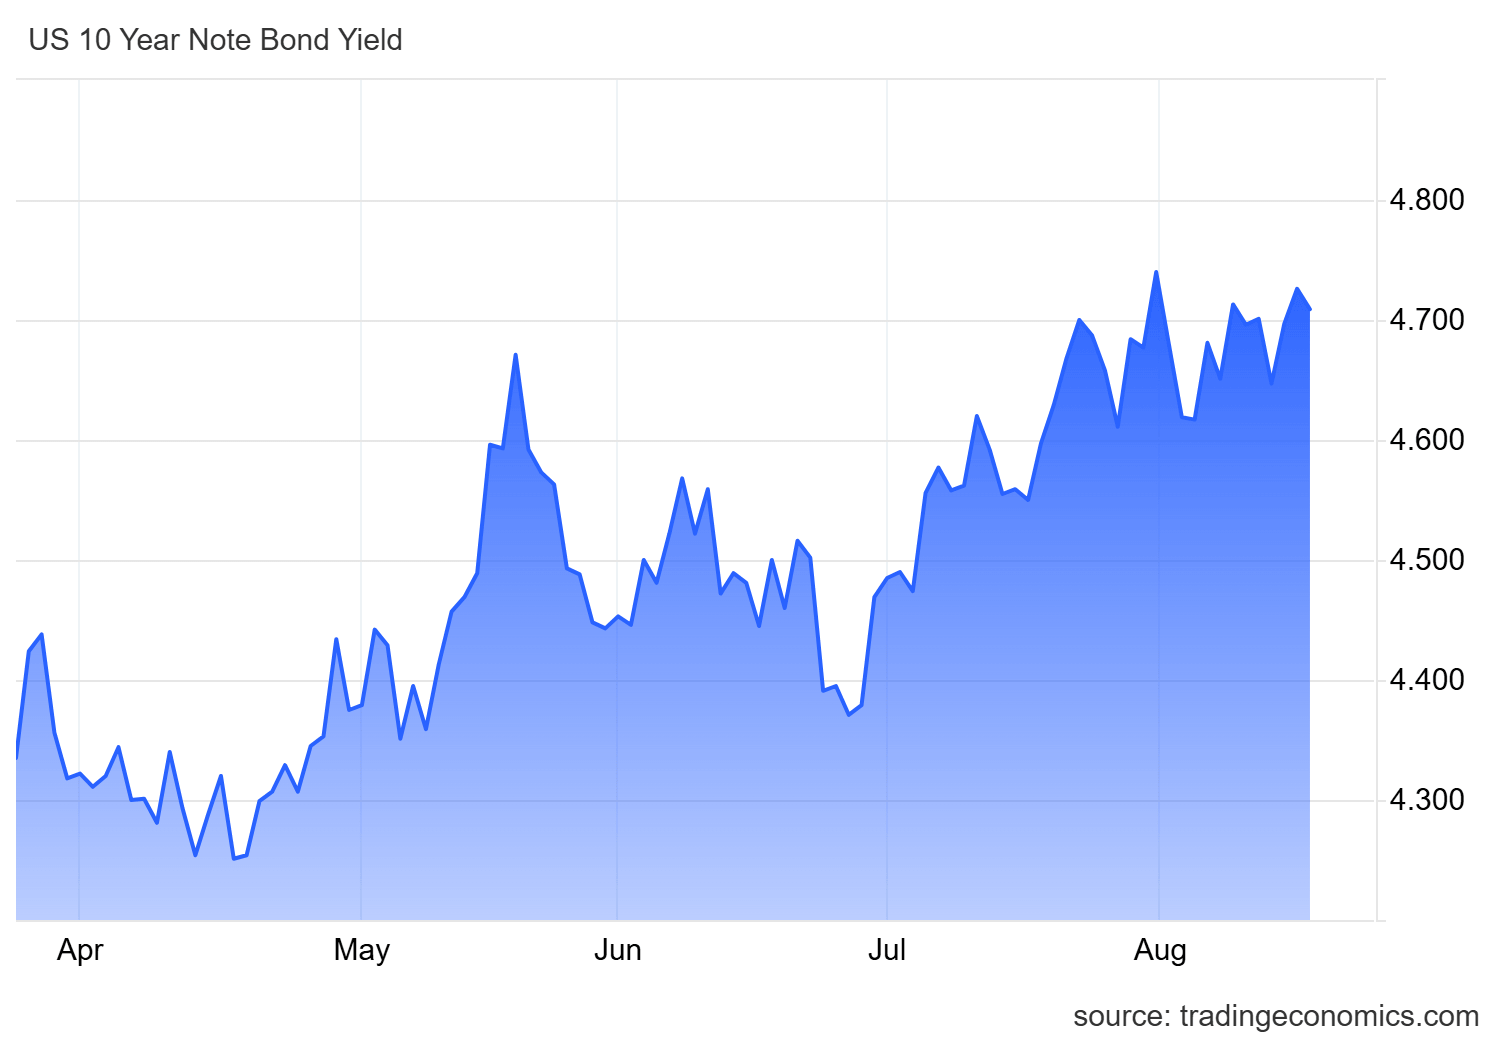
Source: TradingEconomics
In this context, the minutes will be decisive for both fixed income and the US dollar. If the document opens the door to a more hawkish Fed, both markets could gain traction. A strengthening of these alternative assets would diminish gold's appeal as a safe haven, which could stall the recovery attempts seen in recent weeks and trigger a potential drop in short-term demand.
In fact, activity in the gold market has already started to cool off in the sessions leading up to the release. Trading volume for metal futures on August 17 stood at 141,000 contracts, a figure far below the more than 200,000 daily contracts seen earlier in the month. This sustained drop in volume reflects investor caution ahead of potential central bank signals and suggests a lack of appetite for the asset while the monetary outlook remains up in the air.
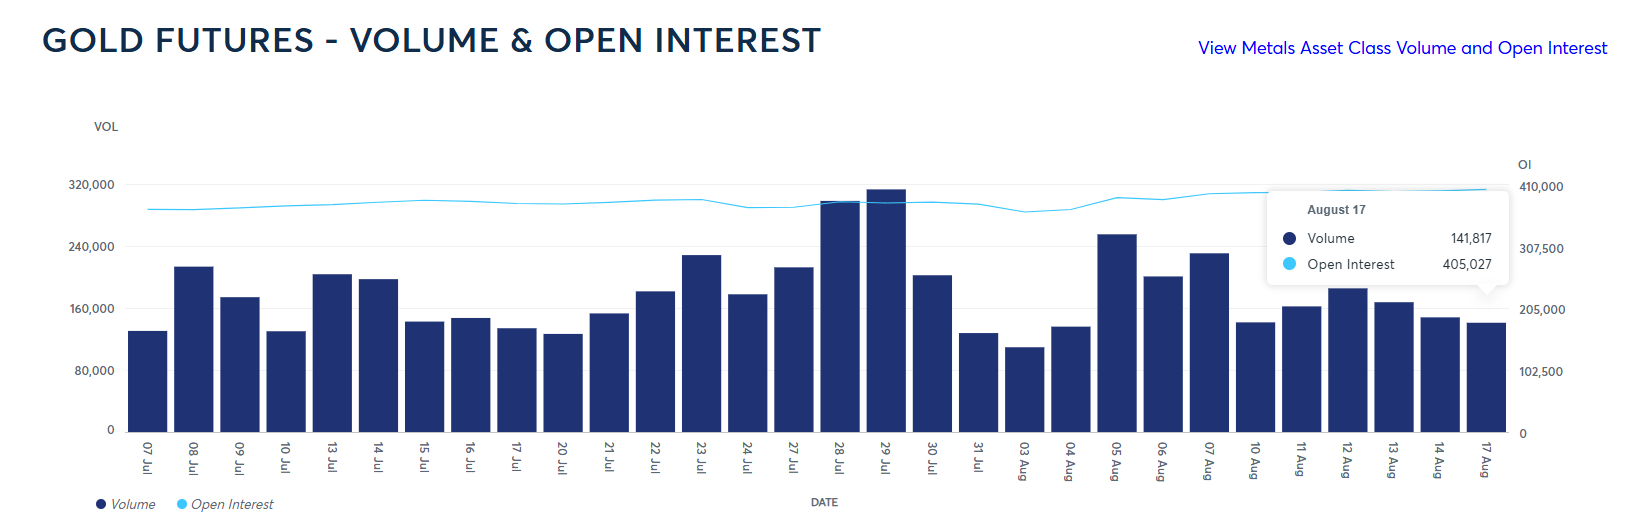
Source: CMEGROUP
With this in mind, gold is likely to remain capped by expectations surrounding its substitute markets, maintaining its neutral stance in the near term. However, if the minutes confirm a more restrictive tone and bonds and the dollar gain traction, fresh selling pressure could be unleashed on XAU/USD over the coming weeks.
Gold Technical Outlook
Source: StoneX, Tradingview
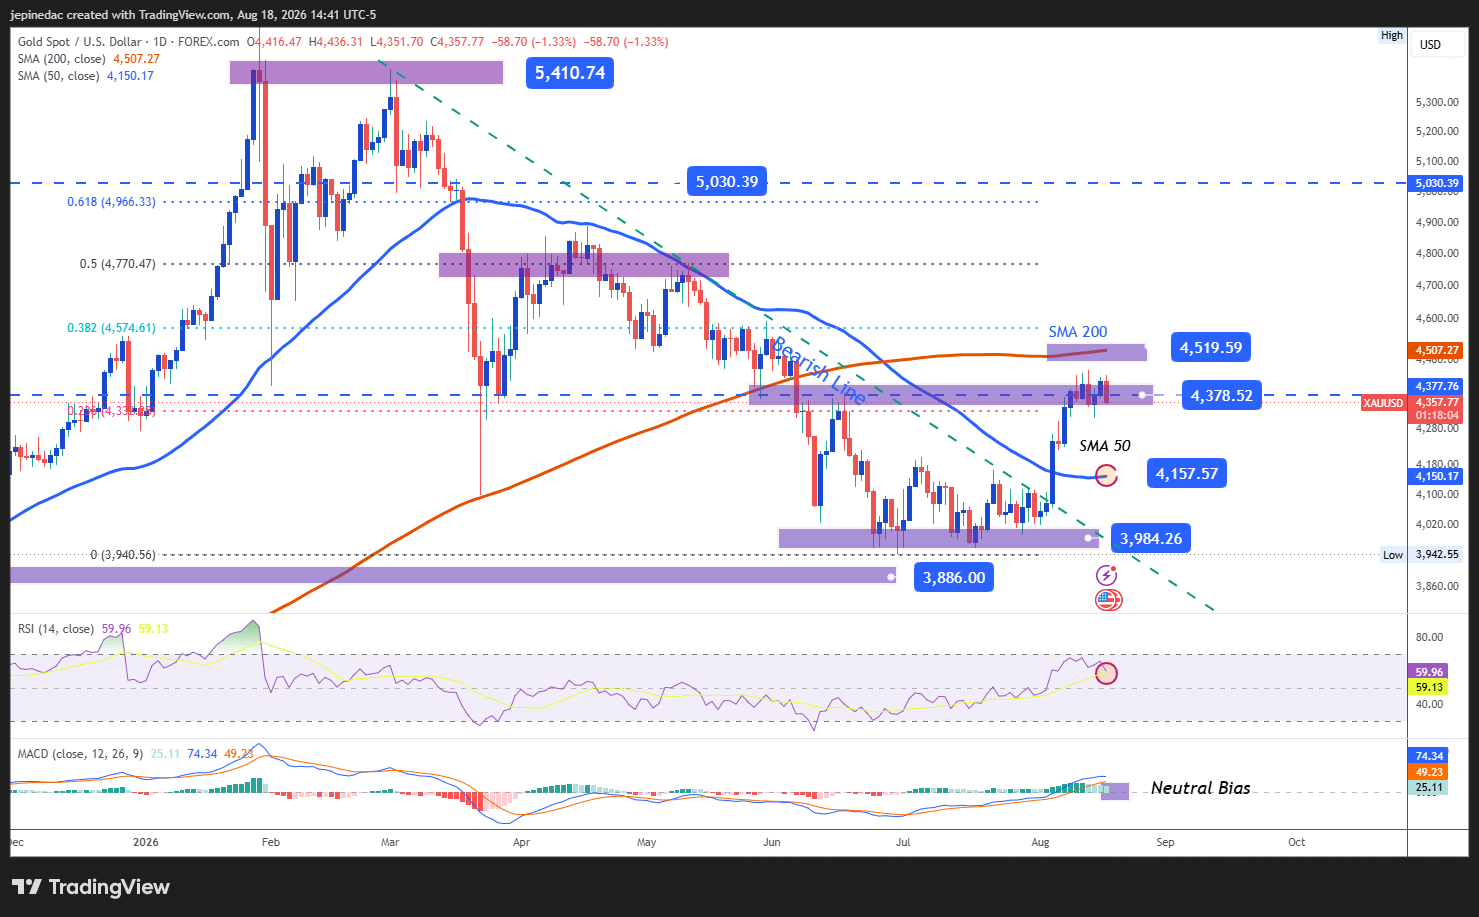
- Bullish momentum faces a slowdown: Average gold price action reflects a clear phase of indecision. Rather than attempting to form a new uptrend line, the price is currently consolidating. As long as key levels remain unbroken, this sideways range could cement itself as the dominant structure in the upcoming sessions.
- RSI: The RSI line shows noticeable flattening behavior, reflecting a loss of momentum from the bullish bias seen in previous sessions. If this behavior persists, the indicator will confirm the neutral phase currently dominating the market.
- MACD: The MACD histogram remains near the neutral 0 line, suggesting that short-term moving average momentum is in balance. This technical reading reinforces the expectation that indecision could remain a primary factor for gold.
Key Levels to Watch:
- $4,500 (Crucial Resistance): A major bullish barrier aligning with the 200-period simple moving average. A sustained close above this level could mark a structural shift on the chart and pave the way for a more prominent bullish bias in the coming sessions.
- $4,378 (Nearby Barrier): The current neutral zone where price action has stalled over the last two weeks. It acts as a key retracement level; if the price fails to break cleanly away from this area, sideways trading could extend in the short term.
- $3,984 (Critical Support): Matches the 2026 lows and stands as the chart's most important support level. A drop to this level could reignite a bearish bias and breathe new life into the downtrend line that dominated the technical structure for weeks.
Written by Julian Pineda, CFA, CMT – Market Analyst
Follow him on: @julianpineda25
Latest market news




Open an account today
Experience award-winning platforms with fast and secure execution.
Economic calendar
Web Trader platform
Our sophisticated web-based platform is packed with features.
Related articles

silver-crash-2026-vs-2011-collapse
Silver has collapsed some 65% from its January peak, drawing uncomfortable comparisons with the 2011 crash. The parallels are striking, but a bigger bubble, a hawkish Federal Reserve and years of supply deficits make this episode different.


Gold and Silver's Deepening Dollar Dilemma
The dollar has broken higher, gold and silver have been crushed, and US financial conditions are tightening rapidly. Our historical analysis suggests this is no ordinary precious metals selloff.


S&P 500 Analysis: SPX Is Going Through One of Its Most Difficult Periods of 2026
Confidence around the U.S. equity market continues to face significant pressure. Over the last three trading sessions alone, the S&P 500 has fallen nearly 3.3%, highlighting a bearish bias that has become increasingly evident across the broader market.
From time to time, StoneX Financial Pty Ltd (“we”, “our”) website may contain links to other sites and/or resources provided by third parties. These links and/or resources are provided for your information only and we have no control over the contents of those materials, and in no way endorse their content. Any analysis, opinion, commentary or research-based material on our website is for information and educational purposes only and is not, in any circumstances, intended to be an offer, recommendation or solicitation to buy or sell. You should always seek independent advice as to your suitability to speculate in any related markets and your ability to assume the associated risks, if you are at all unsure. No representation or warranty is made, express or implied, that the materials on our website are complete or accurate. We are not under any obligation to update any such material.
As such, we (and/or our associated companies) will not be responsible or liable for any loss or damage incurred by you or any third party arising out of, or in connection with, any use of the information on our website (other than with regards to any duty or liability that we are unable to limit or exclude by law or under the applicable regulatory system) and any such liability is hereby expressly disclaimed.