


At the end of June, I outlined the potential for gold to bounce from the $4,000 level. While there was, of course, the obligatory noise around that key support, bulls eventually gained some traction, with gold rising 6.6% from last week's low to Friday's high. Although prices have since pulled back, XAU/USD continues to hold above its recent cycle lows, leaving bulls to ponder whether another leg higher could still unfold.
View related analysis:
- Gold Price Rebound? Futures Positioning Signals Support Above 4,000
- AUD/USD Outlook 2026: Key Drivers for the Australian Dollar in Q3
- FX Futures Positioning: US Dollar, EUR, GBP, JPY | COT Report
- Crude Oil Finds Support at Its Pre-War Close, Gold Bounces and USD Retreats
Why Gold Bulls May Still Have the Upper Hand
Gold Finds Support as Oil Rebounds and US Dollar Rally Fades
It was encouraging to see WTI crude oil prices also bounce from the support level I highlighted last week. Oil prices had fallen 44% from their post-war spike, printed their smallest bearish weekly candle in more than four months, yet consistently held above their pre-war close with near perfection. Crude oil prices have risen by as much as 13% from last week's low as President Trump once again verbally attacks Iran, making it easy work for bulls after an extended selloff into a key support level.
Gold's price action is more nuanced for bulls, but they may still have a case for a cheeky bounce higher, at least over the near term.
Net-long exposure to the US dollar may be nearing a sentiment extreme, which I outlined again in my weekly Commitment of Traders (COT) report. Bulls have also lost a little momentum on the US dollar index rally, which is helping gold hold above 4,000 for now.
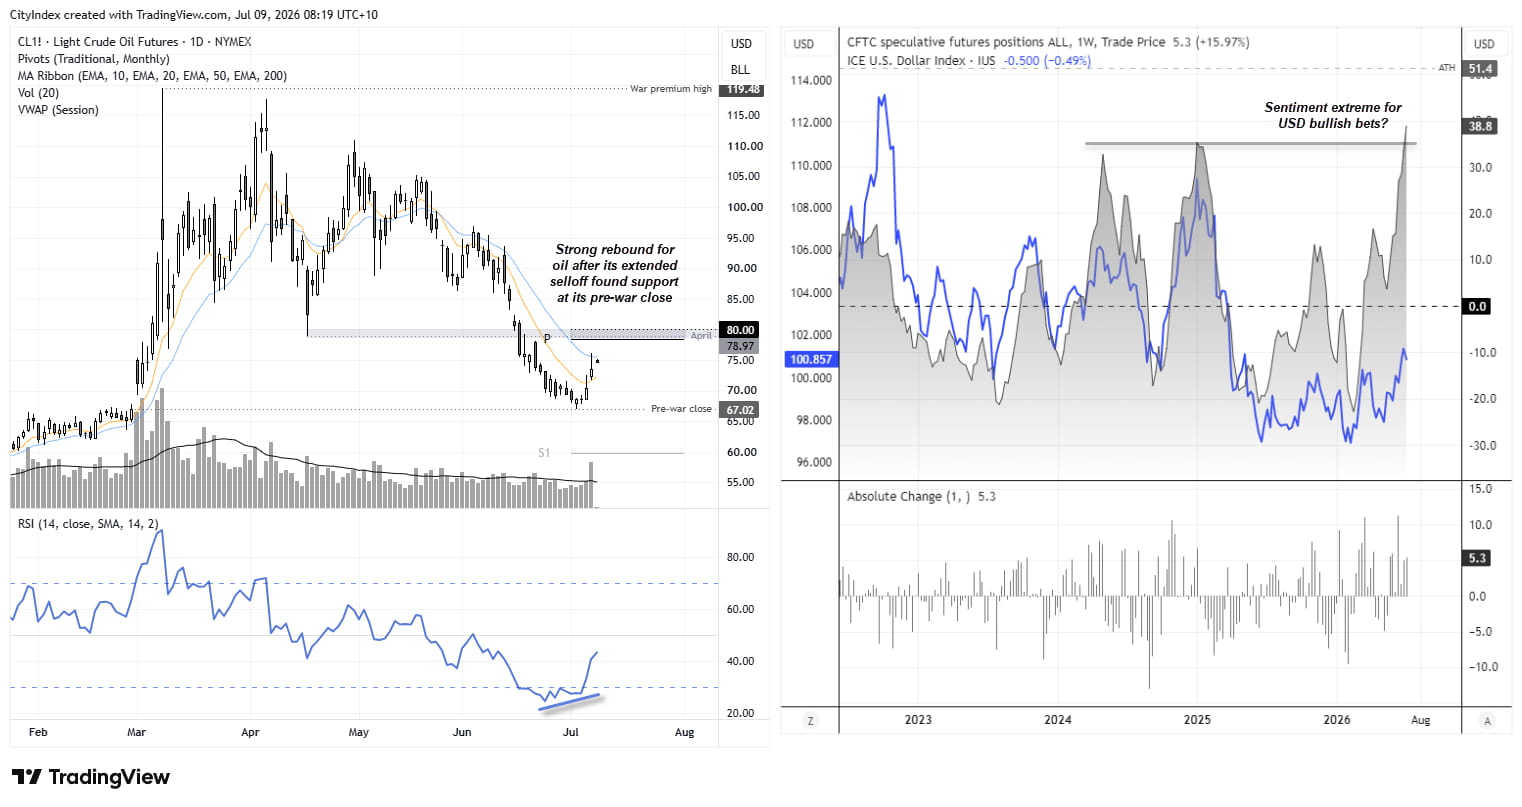
Source: NYMEX, ICE, IMM, CFTC (COT)
Gold Seasonality Favors Bulls in July and August
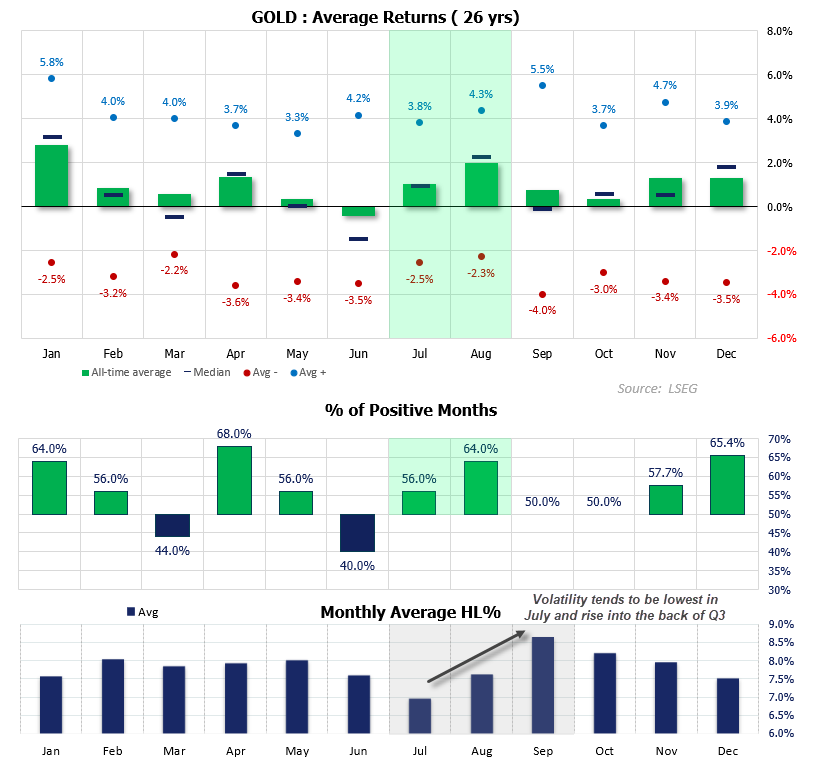
July tends to offer a slight seasonal advantage for bulls, with data since 2000 showing average and median returns of around 1% and a 56% win rate. Among those bullish Julys, the average gain has been 3.8%. August seasonality is even stronger, with a 64% win rate, average and median returns of around 2%, and an average gain of 4.3% during bullish months.
Source: LSEG

Gold's Daily July Seasonality Points to a Bullish Window
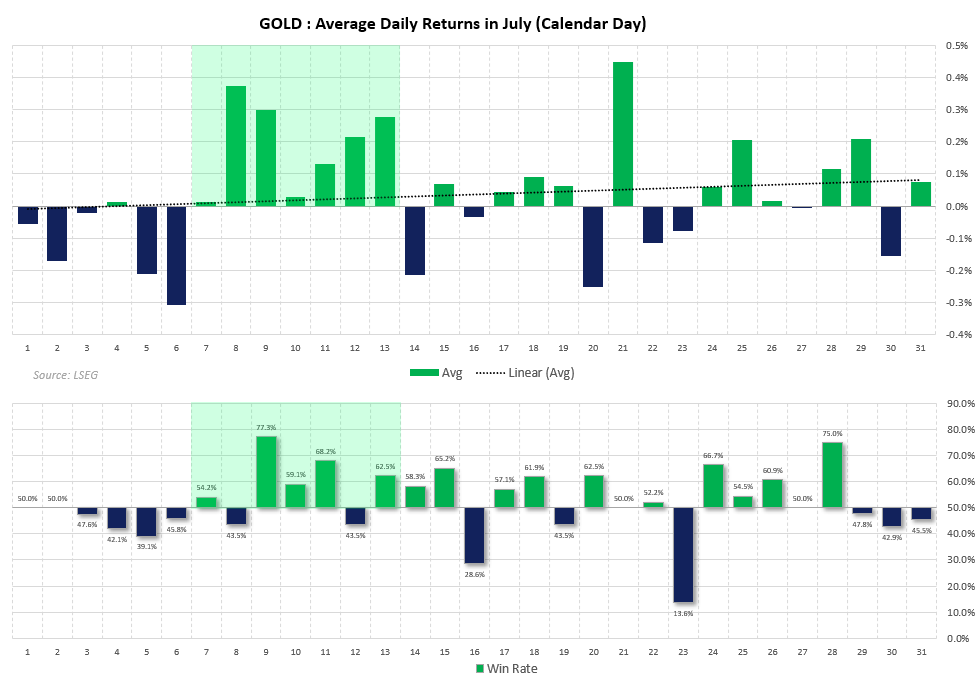
Seasonal patterns may not provide a roadmap for the future, but they can highlight tendencies in price action during quieter periods that are not overshadowed by major economic or geopolitical drivers. With volatility seemingly lower for now and markets seeking a fresh catalyst, perhaps seasonality can play out in the weeks ahead. On that note, gold's daily returns during July also show that 8–13 July tend to deliver positive average returns alongside mostly favourable win rates. Extra caution is warranted when interpreting daily seasonality data, but the pattern is at least worth highlighting.
Source: LSEG
Gold Futures (GC) Technical Analysis
Daily Chart: Gold Bulls Eye a C-Wave Recovery
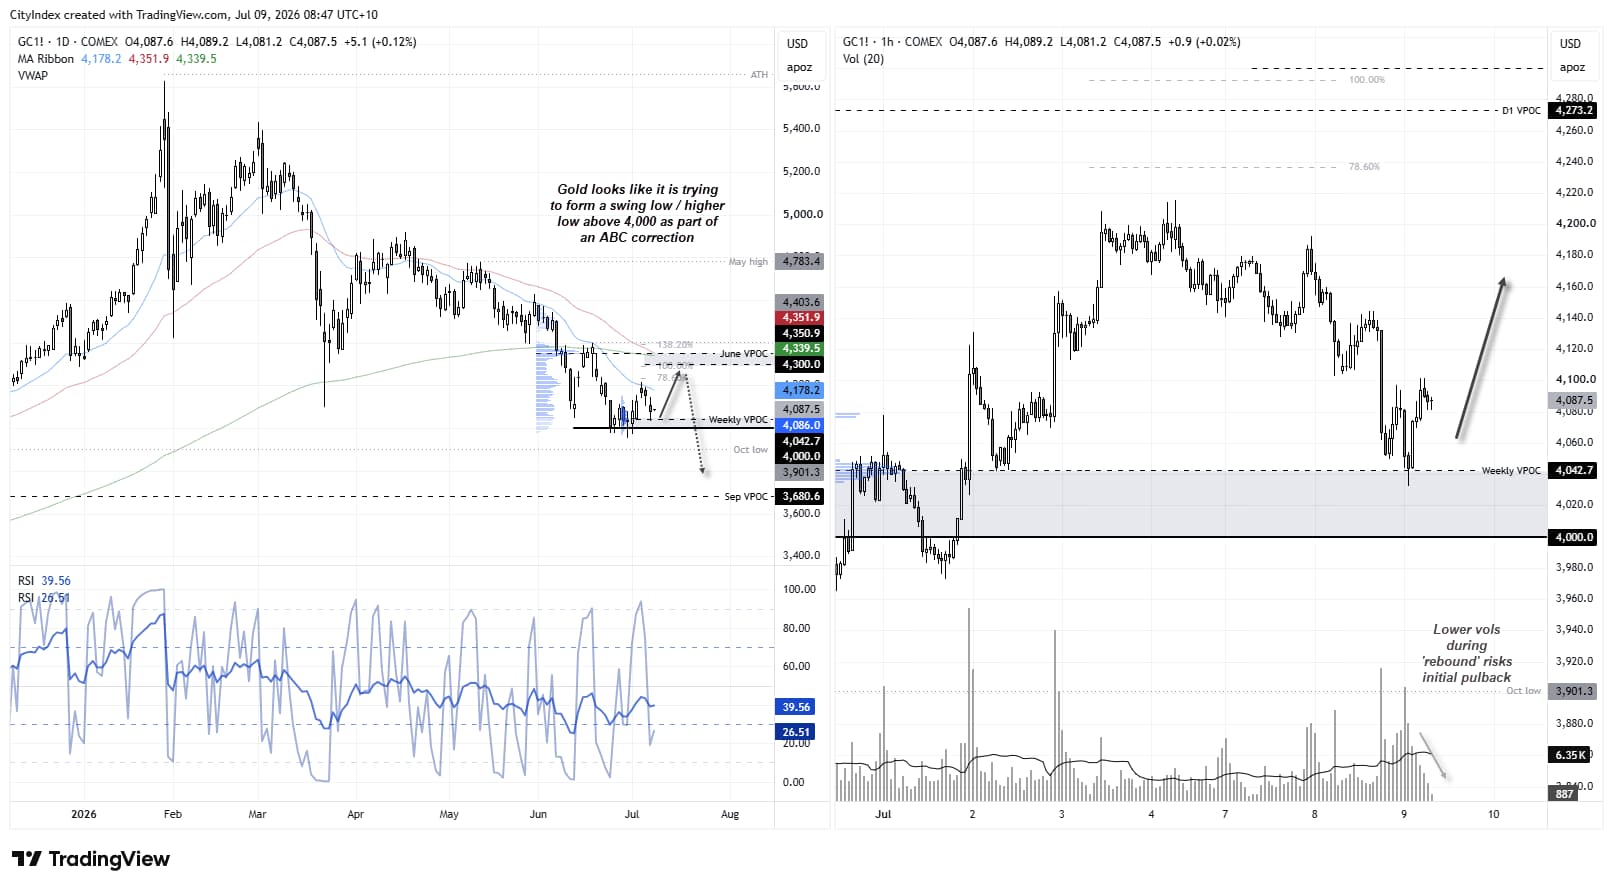
The daily chart shows that while gold remains in a downtrend, it has staged a countertrend rally. The question now is whether bulls have enough fuel in the tank for another leg higher as part of a potential ABC correction. The 20-day EMA continues to cap prices as resistance and momentum has turned lower, yet Wednesday's wide-legged doji suggests bears may already be losing their grip. The fact that this has occurred above 4,000, while gold has entered a period of the month with a slight bullish seasonal tailwind, adds weight to the case for another move higher over the near term as part of the 'C' wave of an ABC correction.

1-Hour Chart: Volume Still Needs to Confirm the Bounce
The 1-hour chart shows Wednesday's low respected last week's volume point of control (VPOC), adding further weight to the case for a potential swing low. That said, volumes during the recent bounce from those lows have declined, suggesting a lack of bullish participation. Bulls may therefore want to remain on guard for a pullback within yesterday's range today.
Source: LSEG
- My near-term bias remains bullish while gold holds above the recent swing lows, and with Wednesday's doji forming above 4,000, bulls may be preparing to make their next move.
- A bullish divergence formed on the daily RSI (14) heading into the swing lows, suggesting the mature bearish trend has been losing momentum.
- Note that the 200-day and 50-day EMAs sit near the June volume point of control (VPOC), just above the 4,300 handle.
- A 100% projection of Wave A from the assumed Wave B low lands near the 4,300 handle.
- With a notable cluster of resistance between 4,300 and 4,340, bears may also be lurking to capitalise on any such bounce with a view to taking gold back below 4,000.
View the full economic calendar
-- Written by Matt Simpson
Follow Matt on Twitter @cLeverEdge




