



Gold Suffers Fifth Worst-Day Drop in 55yrs As Momentum Trade Unwinds
Gold plunged 5.7% in its fifth-worst session since 1970 as the momentum-fuelled rally snapped, leaving traders watching $4,000 for support.
Share this:

For some time now, I’ve been saying that gold had effectively become a pure momentum trade — one where the yellow metal was denied any meaningful pullback as traders chased prices higher. It always ends with a thud, and that’s exactly what we saw on Tuesday, with spot prices plunging 5.7%.
Not only was it a particularly volatile session, but it also ranked as gold’s fifth most bearish trading day on record, dating back to 1970. The drop was only slightly behind the 5.8% sell-offs seen in March 2008 and September 2011.
View related analysis:
- Gold Volatility Perks Up At $4k, Though Pullbacks Could Be Limiteda>
- Nikkei Hits 50k, Nasdaq Bulls Eye Record High Amid Thawing Trade Tensions
- ASX 200 Morning Market Outlook: ASX Hits Record High, Materials Lead
- Canadian Dollar Price Action Setups Into CPI: USD/CAD, GBP/CAD, EUR/CAD
- Japanese Yen Price Action Setups: USD/JPY, EUR/JPY, AUD/JPY
View related analysis:
- Gold Volatility Perks Up At $4k, Though Pullbacks Could Be Limiteda>
- Nikkei Hits 50k, Nasdaq Bulls Eye Record High Amid Thawing Trade Tensions
- ASX 200 Morning Market Outlook: ASX Hits Record High, Materials Lead
- Canadian Dollar Price Action Setups Into CPI: USD/CAD, GBP/CAD, EUR/CAD
- Japanese Yen Price Action Setups: USD/JPY, EUR/JPY, AUD/JPY
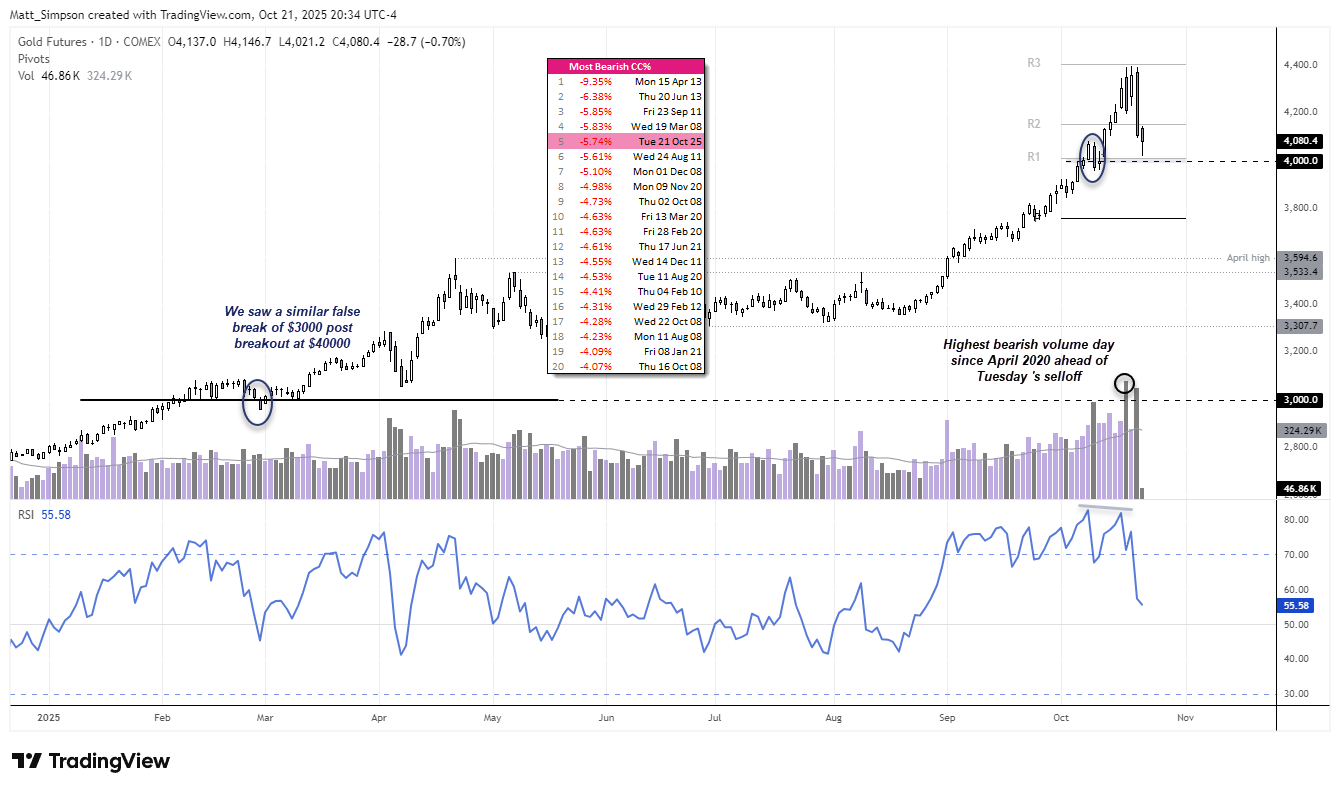
Chart analysis by Matt Simpson, Source: TradingView, COMEX Futures, Gold, LSEG
Hindsight is a wonderful thing, but the sell-off did not come without warning. Daily volatility had been rising alongside prices for more than a week, while a bearish divergence had formed against extremely overbought RSI(14) levels. More importantly, Friday’s bearish engulfing candle was accompanied by the highest daily volume since August 2020. This suggested that bearish initiation was far greater than expected given the day’s range — and that sellers held their ground at least through to yesterday. Tuesday’s trading volume was also gold’s second-highest daily print in over five years.


Gold Futures (GC) Technical Analysis
The 1-hour chart shows clear bearish follow-through from Tuesday’s sell-off, followed by a swift rebound at the monthly pivot just above the $4,000 level. Given the significance of this area for gold, an immediate break lower appears unlikely.
The RSI(14) also formed a bullish divergence and is now curling higher from oversold territory. This rebound, coupled with renewed two-way volatility, could see prices retest resistance near the weekly R2 pivot around $4,150. However, with the weekly pivot and Friday’s swing low near $4,200, bears may look to reload and attempt another push towards $4,000 in the near term.
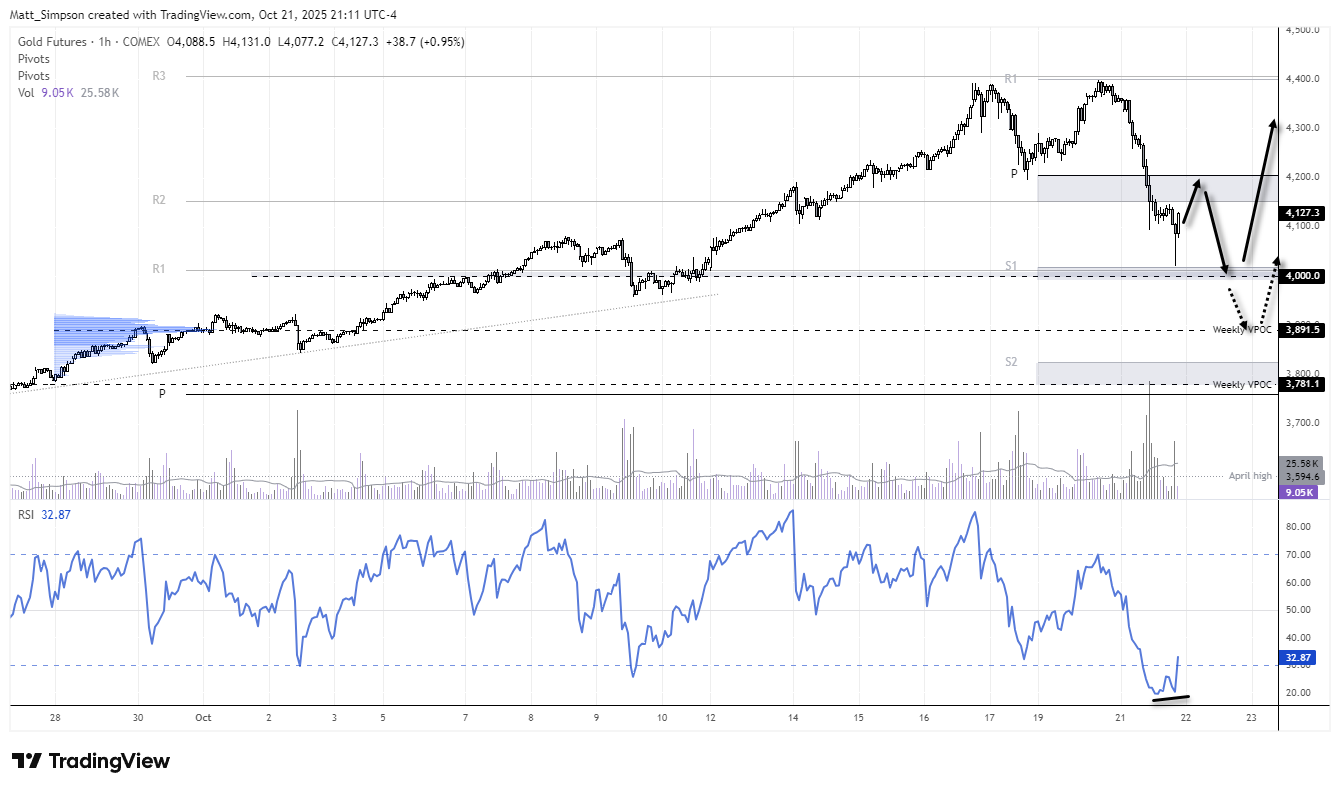
Chart analysis by Matt Simpson - Source: COMEX, LSEG
View the full economic calendar
View the full economic calendar
-- Written by Matt Simpson
Follow Matt on Twitter @cLeverEdge
How to trade with City Index
You can trade with City Index by following these four easy steps:
- Open an account, or log in if you’re already a customer
• Open an account in the UK
• Open an account in Australia
• Open an account in Singapore
- Search for the market you want to trade in our award-winning platform
- Choose your position and size, and your stop and limit levels
- Place the trade
Related tags:



Open an account today
Experience award-winning platforms with fast and secure execution.
Economic calendar
Web Trader platform
Our sophisticated web-based platform is packed with features.
Related articles
Gold Price Forecast: XAU/USD Breaks Multi-Year Uptrend in Worst Week Since March 11 21 2026
XAU/USD is approaching a critical support confluence after relentless selling, with stretched momentum raising the prospect of downside exhaustion.

USD/JPY Weekly Outlook: Yen Carry Unwind Risks Flash Red
A historic Nasdaq 100 selloff has revived fears of a disorderly yen carry trade unwind. Yet futures positioning, options pricing and Thanksgiving seasonality suggest the biggest threat to USD/JPY could come from the Fed itself.


silver-crash-2026-vs-2011-collapse
Silver has collapsed some 65% from its January peak, drawing uncomfortable comparisons with the 2011 crash. The parallels are striking, but a bigger bubble, a hawkish Federal Reserve and years of supply deficits make this episode different.

From time to time, StoneX Financial Pty Ltd (“we”, “our”) website may contain links to other sites and/or resources provided by third parties. These links and/or resources are provided for your information only and we have no control over the contents of those materials, and in no way endorse their content. Any analysis, opinion, commentary or research-based material on our website is for information and educational purposes only and is not, in any circumstances, intended to be an offer, recommendation or solicitation to buy or sell. You should always seek independent advice as to your suitability to speculate in any related markets and your ability to assume the associated risks, if you are at all unsure. No representation or warranty is made, express or implied, that the materials on our website are complete or accurate. We are not under any obligation to update any such material.
As such, we (and/or our associated companies) will not be responsible or liable for any loss or damage incurred by you or any third party arising out of, or in connection with, any use of the information on our website (other than with regards to any duty or liability that we are unable to limit or exclude by law or under the applicable regulatory system) and any such liability is hereby expressly disclaimed.