



Nasdaq 100 Rebound Puts Bears on Notice
Nasdaq futures are flying despite further negative AI infrastructure headlines. History suggests fading strong Monday opening rallies hasn't always paid off, while the technical picture is starting to turn in favour of bulls.
Share this:

- Nasdaq futures surged 1.6% during Monday's opening four hours
- Strong opening rallies have historically favoured further upside
- Intraday reversals remain common despite positive directional tendencies
- Bullish key reversal puts Nasdaq 100 bears on notice
Nasdaq Futures Surge in Asia. Fade or Follow?
Nasdaq futures have surged in Asian trade on Monday, reversing an initial gap lower to gain 1.6% during the opening four hours of trade following last week's heavy selling in technology stocks.
The massive rebound comes despite further evidence of building headwinds towards the AI infrastructure build-out, with Nvidia-backed Nscale reportedly facing resistance to its proposed US$30 billion IPO valuation, according to Bloomberg.
That follows valuation concerns forcing fellow Nvidia-backed data centre developer Firmus to abandon its planned ASX listing earlier this month. On top of that, Microsoft has also withdrawn from one of Nscale's UK data centre projects due to power connection delays.
Rather than derailing the rebound, the headlines have been shrugged off so far, raising the question of whether this is the kind of opening move traders should fade or follow.
To find out, I looked at Nasdaq 100 futures performance going back to 2013, comparing the opening four hours of Monday trading with what happened over the remainder of the session.
Strong opening rallies have historically attracted further buying
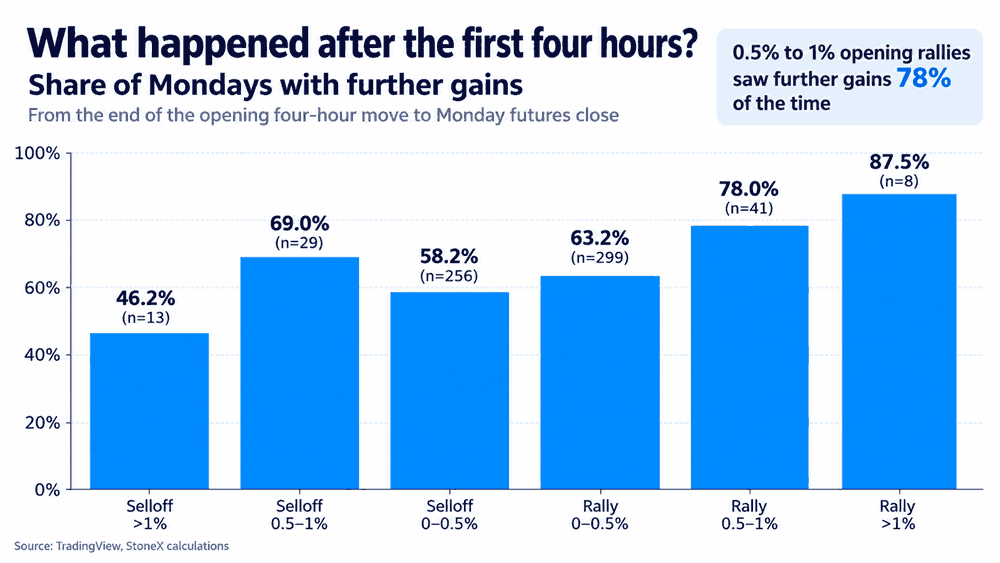
Looking at the 646 Mondays over the period, Nasdaq futures have shown a clear tendency to extend larger opening rallies over the remainder of the session.
Source: TradingView
When futures gained between 0.5% and 1% during the first four hours of trade, further gains followed on 78% of occasions. For opening rallies exceeding 1%, the category today's 1.6% surge falls into, that increased to 87.5%, although the latter was based on just eight observations.
Both figures point to a considerably stronger directional tendency than that seen following opening declines of a similar magnitude.
Often not a one-way ticket higher
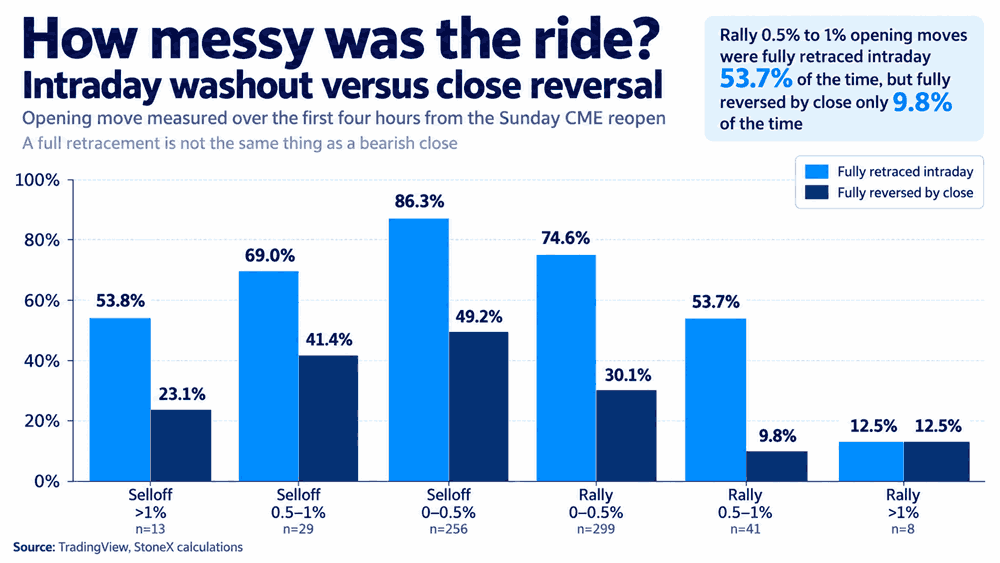
However, before chasing the rally, be aware that historical data suggests the move is often not a one-way ride.
Source: TradingView
When Nasdaq futures gained between 0.5% and 1% during the opening four hours of trade, the entire advance was subsequently retraced at some point during Monday's session on more than half of occasions.
Yet despite that volatility, just 9.8% of those sessions finished below the price at which futures reopened on Sunday evening.
Interestingly, when the opening rally exceeded 1%, the entire move was retraced on just one of eight occasions, suggesting unusually strong opening gains have historically been more resilient to subsequent selling.
There's no guarantee the same will happen this time, but it suggests traders have often had to contend with substantial intraday volatility, even when the initial buying ultimately proved to be a decent directional tell for how the session would finish.
Subsequent gains have often been substantial
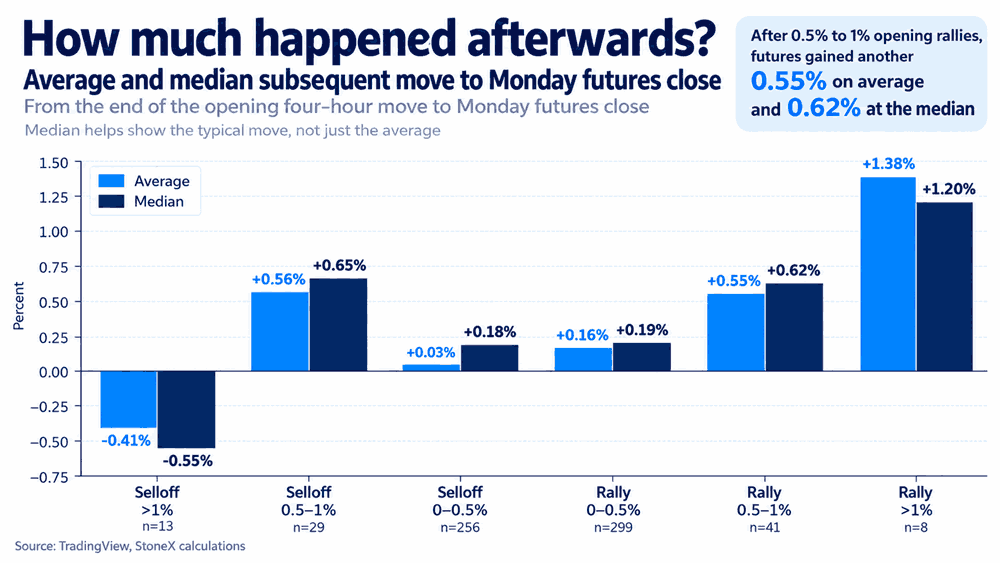
It's not just the frequency of subsequent gains that's worth considering, but also their magnitude.
Source: TradingView
Following opening rallies of between 0.5% and 1% in the first four hours of trade, Nasdaq futures gained another 0.55% on average over the remainder of Monday, with a median increase of 0.62%.
For opening rallies exceeding 1%, the average subsequent gain rose to 1.38%, with a median increase of 1.20%. However, with just eight observations, caution is needed when interpreting those larger moves.
Nasdaq 100 bullish key reversal puts bears on notice
Source: TradingView
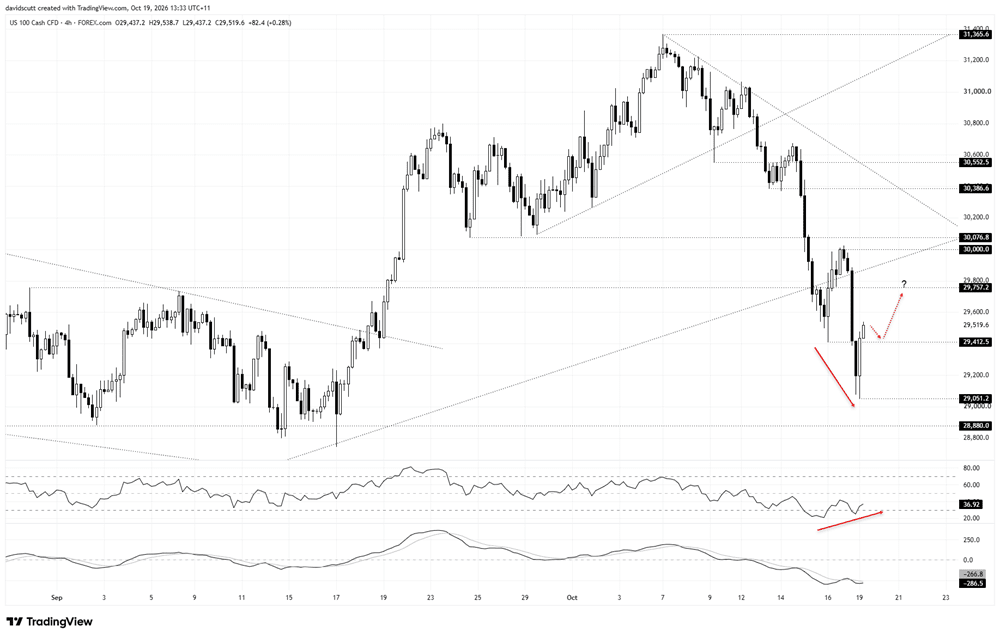
The Nasdaq 100 contract has staged a sharp rebound following last week's prolonged decline, printing a bullish key reversal on the four-hourly timeframe. Coming after sustained selling pressure, the pattern suggests directional risks may be shifting higher, making price action later on Monday important.
Adding to the bullish reversal is divergence between price and RSI (14), with the former setting lower lows while the latter has formed higher lows. While RSI (14) and MACD continue to suggest downside pressure remains dominant, momentum is showing signs of recovering rather than deteriorating further.
On the downside, 29,412.5 is the immediate level to watch, having provided support on October 16. A pullback towards the level that attracts renewed buying may provide an opportunity to initiate longs, allowing for a tight stop to be placed beneath it for protection.
The initial upside target would be 29,757.2, the August 28 high. This level has been tested repeatedly, acting as both resistance and support. Beyond that, the psychological 30,000 level and 30,076.8, the swing low set in late September prior to the latest breakdown, are additional upside levels to watch.
While the uptrend extending from the late-March low has been broken, that doesn't prevent a counter-trend squeeze, particularly if buyers defend support during any retracement of Monday's initial rally.
Latest market news




Open an account today
Experience award-winning platforms with fast and secure execution.
Economic calendar
Web Trader platform
Our sophisticated web-based platform is packed with features.
Related articles
S&P 500 Grasps At Support as Surging Hike Odds, Treasury Yields Threaten Larger Turn
Stocks continue to turn in Q4 and the post-earnings bounce from NVDA has been faded, while the S&P 500 grasps on to a support level with a large amount of open space below.
Euro Short-term Outlook: EUR/USD Plunges to 19-Month Low—Bears Face Critical Test 11 18 2026
The Euro selloff is now approaching pivotal support, raising the prospect of downside exhaustion as the November decline extends.

Copper forecast: risk-off mood and demand worries sink prices below $6
Copper has broken below $6, its 200-day moving average and a trend line dating back to August 2025. With industrial metals under pressure and the dollar firm, $5.50 is now the level to watch.

From time to time, StoneX Financial Pty Ltd (“we”, “our”) website may contain links to other sites and/or resources provided by third parties. These links and/or resources are provided for your information only and we have no control over the contents of those materials, and in no way endorse their content. Any analysis, opinion, commentary or research-based material on our website is for information and educational purposes only and is not, in any circumstances, intended to be an offer, recommendation or solicitation to buy or sell. You should always seek independent advice as to your suitability to speculate in any related markets and your ability to assume the associated risks, if you are at all unsure. No representation or warranty is made, express or implied, that the materials on our website are complete or accurate. We are not under any obligation to update any such material.
As such, we (and/or our associated companies) will not be responsible or liable for any loss or damage incurred by you or any third party arising out of, or in connection with, any use of the information on our website (other than with regards to any duty or liability that we are unable to limit or exclude by law or under the applicable regulatory system) and any such liability is hereby expressly disclaimed.