


New Zealand dollar outlook: NZD/USD breakout sets stage for bigger move
NZD/USD has broken free from its September downtrend, clearing the 50DMA and .5755 resistance. With RSI trending higher and MACD confirming the bullish tone, dips look attractive for those chasing upside continuation.
Share this:

- Bullish breakout confirmed above September downtrend
- RSI rising, MACD positive, momentum favours upside
- Key levels: .5755 support, .5800 resistance
- Yield spreads and risk appetite fuelling NZD/USD strength
NZD/USD Summary
NZD/USD has delivered on the bullish breakout risk flagged last week, surging through major resistance and hitting multi-month highs. Technicals and momentum indicators point to further upside, with .5800 and beyond in focus. Pullbacks towards .5755 may offer attractive entry points for longs, while a reversal under the 50DMA would challenge the bullish bias. For now, the Kiwi looks set to thrive on strong risk appetite and narrowing yield differentials.
Kiwi Breakout Builds
Source: TradingView
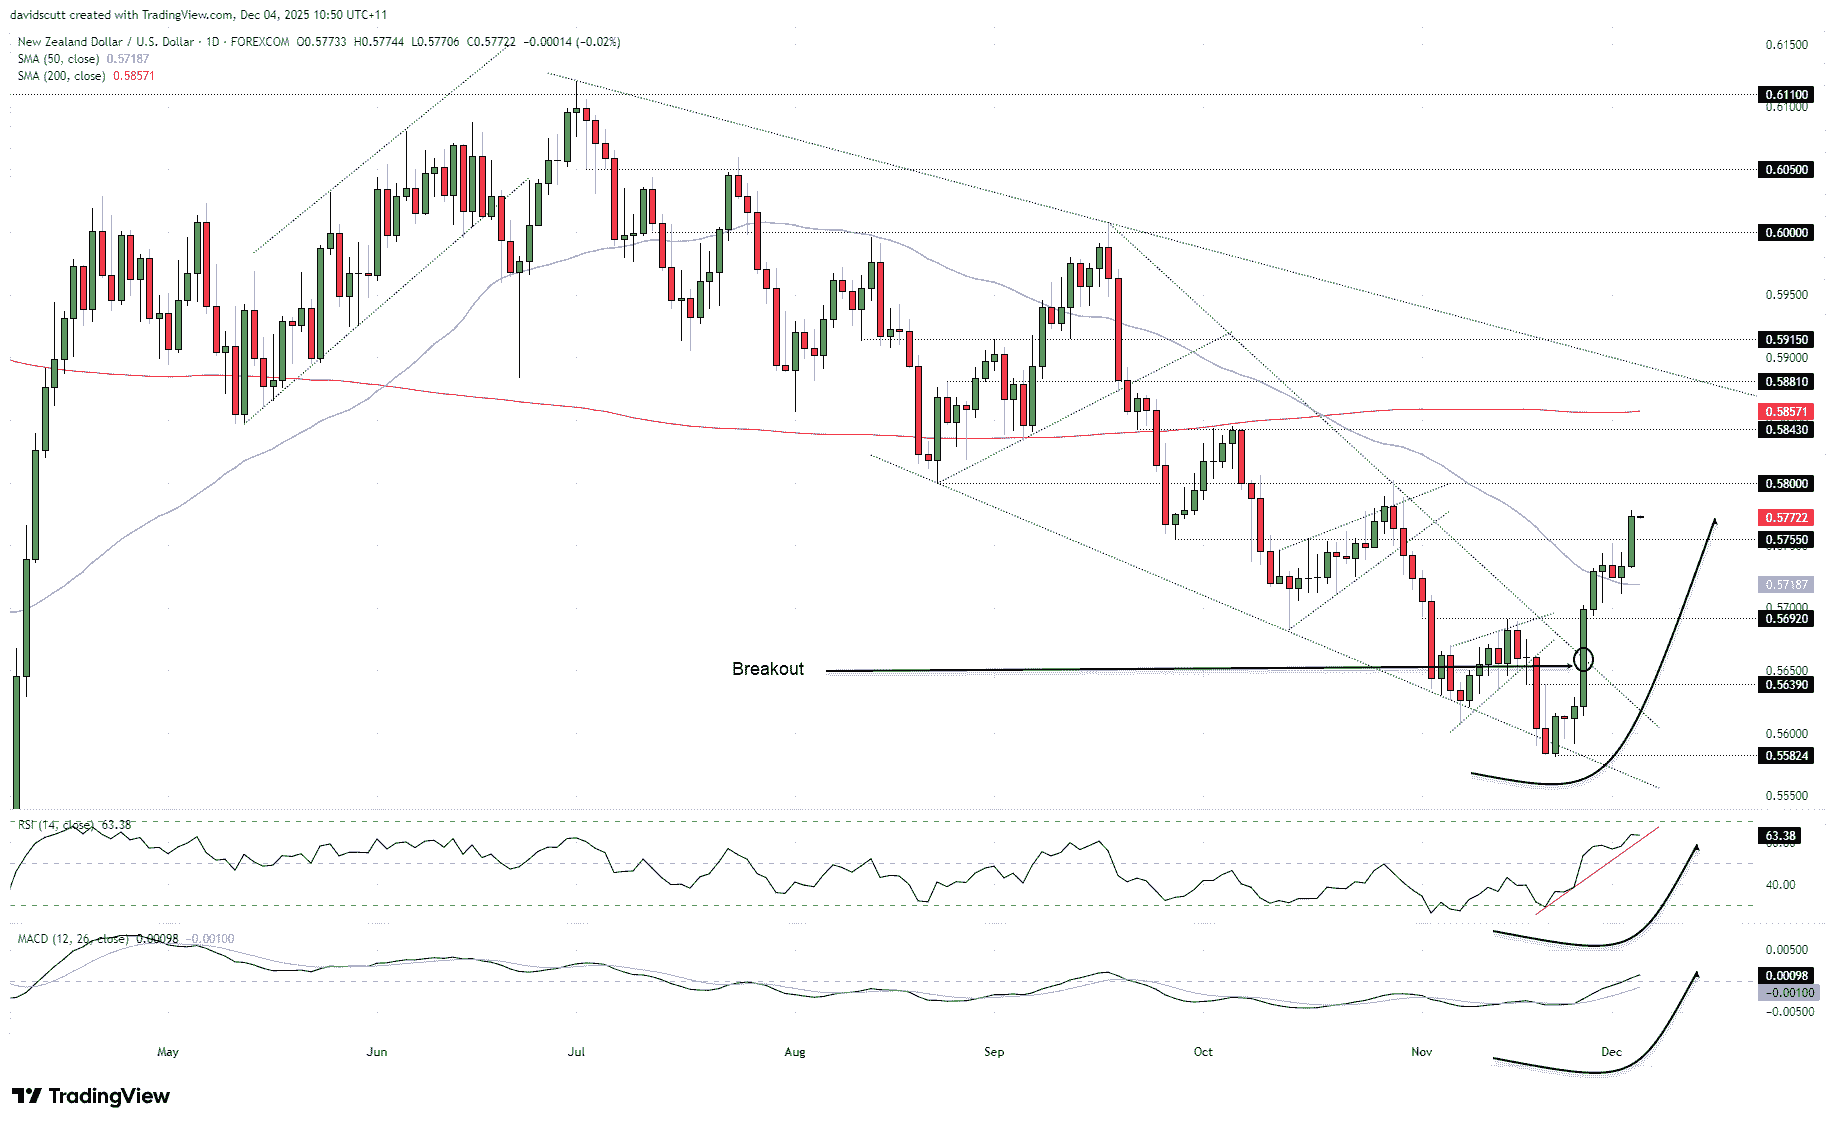
Turning to the technicals, the bullish breakout risk flagged before the RBNZ’s November interest rate meeting has played out nicely, with the price smashing through the September downtrend before continuing the move, taking out resistance at .5692, the 50DMA and .5755 along the way, leaving the pair sitting at fresh multi-month highs. Convention suggests the breakout from the falling wedge may see the price eventually return to where it formed, putting the September high above .6000 on the radar as an eventual target.
Right now, NZD/USD trades between two known levels of .5755 on the downside and .5800 on the upside, putting price action within that range in focus in the near term. With RSI (14) trending higher but not yet overbought, upside pressure is building, favouring buying dips and bullish breakouts over selling into strength. MACD has confirmed the bullish message by crossing the signal line from below before pushing into positive territory.
Given recent price action and momentum signals, pullbacks towards .5755 may therefore be bought into, providing a decent entry level for longs given a stop could be placed beneath the level for protection against reversal. Above .5800 resistance, .5843 and the 200DMA should be in focus, allowing for assessment of long trades should the bullish move extend there.
While the picture looks peachy for bulls right now, a reversal back beneath the 50DMA would question the merits of retaining a bullish bias, opening the door for trades looking for sideways or bearish price action.


Risk Rally, Rates Fuel Upside
Source: TradingView
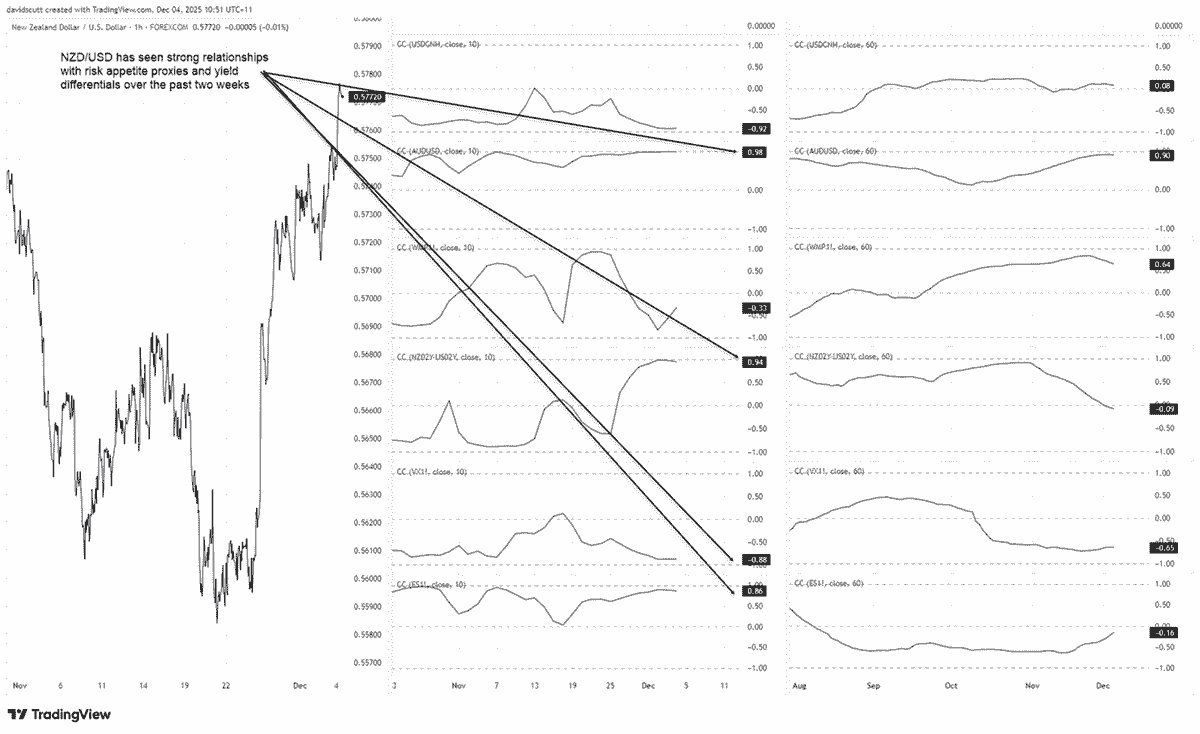
Looking at what may be influencing the Kiwi’s recent outperformance, it’s obvious from the correlation coefficient scores in the middle pane above tracking relationships over the past fortnight that a combination of improved risk appetite and narrowing yield differentials has provided something akin to rocket fuel for NZD/USD upside. At 0.94, the correlation with two-year yield differentials between New Zealand and the United States has been very strong, emphasising the importance of divergent monetary policy outlooks in both nations.
Risk appetite also looks to be a factor, with strengthening relationships with VIX and S&P 500 futures, along with AUD/USD, over the same period. For now, there is no meaningful relationship between the Kiwi and milk futures, with weakness in the latter not impeding upside in the currency.
Over a longer timeframe, the Kiwi has not shown a strong relationship with anything other than the Aussie dollar over the past quarter, although a moderate inverse correlation with VIX futures, which has been sustained for months, hints the Kiwi may thrive in low-volatility conditions. Keep that in mind when assessing both short and longer-term setups involving NZD/USD.
Latest market news




Open an account today
Experience award-winning platforms with fast and secure execution.
Economic calendar
Web Trader platform
Our sophisticated web-based platform is packed with features.
Related articles
USD/JPY Weekly Outlook: Yen Carry Unwind Risks Flash Red
A historic Nasdaq 100 selloff has revived fears of a disorderly yen carry trade unwind. Yet futures positioning, options pricing and Thanksgiving seasonality suggest the biggest threat to USD/JPY could come from the Fed itself.
US Dollar Freight Train Drives EUR/USD, GBP/USD to Fresh Lows
A hawkish Fed and growing jitters around AI have pushed a continued rally in the Greenback, and there’s not yet an end in sight.

Japanese Yen Forecast: USD/JPY Bulls Falter at Major Resistance—Critical Range Break in Focus 11 20 2026
USD/JPY’s latest retreat puts the September recovery under scrutiny, with nearby support offering bulls their next opportunity to respond.

From time to time, StoneX Financial Pty Ltd (“we”, “our”) website may contain links to other sites and/or resources provided by third parties. These links and/or resources are provided for your information only and we have no control over the contents of those materials, and in no way endorse their content. Any analysis, opinion, commentary or research-based material on our website is for information and educational purposes only and is not, in any circumstances, intended to be an offer, recommendation or solicitation to buy or sell. You should always seek independent advice as to your suitability to speculate in any related markets and your ability to assume the associated risks, if you are at all unsure. No representation or warranty is made, express or implied, that the materials on our website are complete or accurate. We are not under any obligation to update any such material.
As such, we (and/or our associated companies) will not be responsible or liable for any loss or damage incurred by you or any third party arising out of, or in connection with, any use of the information on our website (other than with regards to any duty or liability that we are unable to limit or exclude by law or under the applicable regulatory system) and any such liability is hereby expressly disclaimed.