



NZD/USD Forecast: RBNZ hawkish shift meets ceasefire relief at key technical test
RBNZ lays the groundwork for hikes while easing energy risks fuel risk appetite. NZD/USD now at a make-or-break test of its February downtrend.
Share this:

- RBNZ holds OCR at 2.25%, as expected
- Signals “decisive and timely” hikes if inflation persists
- Markets bring forward tightening, July favoured for first move
- NZD/USD at key downtrend test as ceasefire lifts risk sentiment
Summary
The RBNZ’s hawkish tilt, reinforced by pricing that now leans towards a mid-year start to tightening, is providing a tailwind for the kiwi, but the bigger driver on Wednesday has been the risk-on move triggered by the Iran ceasefire extension, which has seen energy prices ease and pro-cyclical currencies bid.
That combination has NZD/USD now pressing against the downtrend it’s been in since early February, with a break opening the door to a broader shift higher, while failure would keep the longer-term structure intact.
RBNZ hawkish hold signals tightening bias
The RBNZ left the OCR unchanged at 2.25% at the April meeting, as expected, but it was the sprinkling of hawkish commentary within the policy statement and Governor Anna Breman’s press conference that caught the market’s eye.
The hawkish tilt began in the final paragraph of the statement, where the bank communicates its outlook for policy. Six weeks ago, the Committee was still talking about policy remaining accommodative with gradual normalisation as the recovery strengthened. That’s now gone.
In its place, the Committee shifted the focus squarely onto inflation outcomes, stating that core inflation, wage growth and inflation expectations must remain contained, warning that “decisive and timely increases in the OCR would be required” if they do not.
The RBNZ operates with a single mandate focused on price stability, meaning inflation sits at the centre of policy decisions, unlike central banks with dual mandates that must also weigh employment outcomes. As a result, it tends to respond more quickly and forcefully to inflation shocks when risks begin to build.
Breman opens door to earlier hikes
The hawkish tone carried through into Anna Breman’s press conference an hour after the decision, where she confirmed the Committee discussed raising rates at this meeting, although there were no strong advocates to move. There was also discussion around moving pre-emptively to guard against any potential inflation outbreak. Importantly, Breman noted the neutral rate sits around 3.0%, 75 basis points above the current cash rate, reinforcing that policy remains accommodative.
Importantly, she said she’s not yet seeing evidence of rising prices becoming embedded in inflation expectations, providing a clear signal on what traders should be watching when it comes to the possible timing of the bank’s first hike.
On that front, the next update from the RBNZ’s influential Survey of Expectations report is due on May 13, two weeks before it next meets to discuss rates.
Markets bring forward tightening bets
Source: Bloomberg
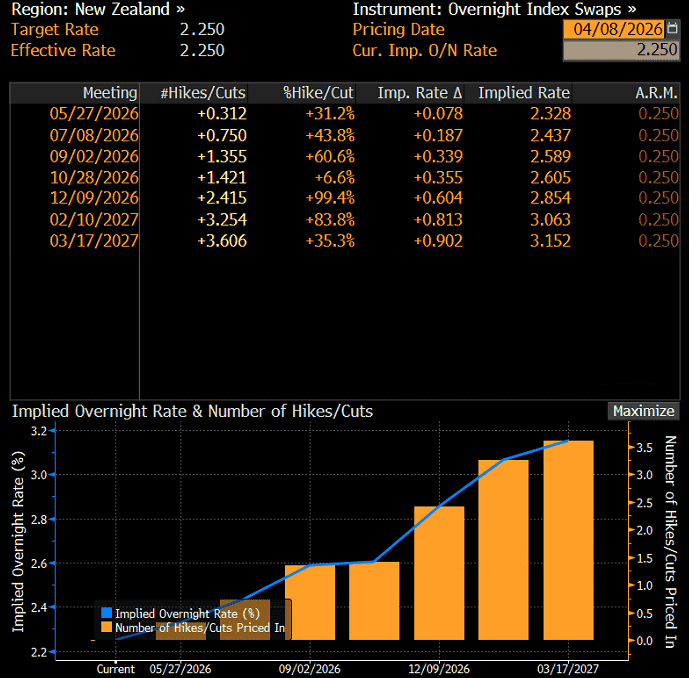
Market pricing shifted more hawkish relative to where it sat prior to the April decision. Implied probabilities from swaps markets now point to roughly a one-in-three chance of a hike in May, around double previous levels.
July is seen as the most likely starting point for the tightening cycle at around 75%, while a hike is fully priced by September with a reasonable chance of a follow-up by that meeting ahead of the national election in November. There is a caveat around activity further out the swaps curve, but there is now more than 3.5 hikes priced by March 2027.
That’s helping to boost the kiwi at the margin, although the far more powerful driver today has been the deadline extension reached between the US and Iran, which has triggered a clear risk-on move across markets, sending oil lower and lifting pro-cyclical currencies.
NZD/USD squeezes against downtrend
Source: TradingView
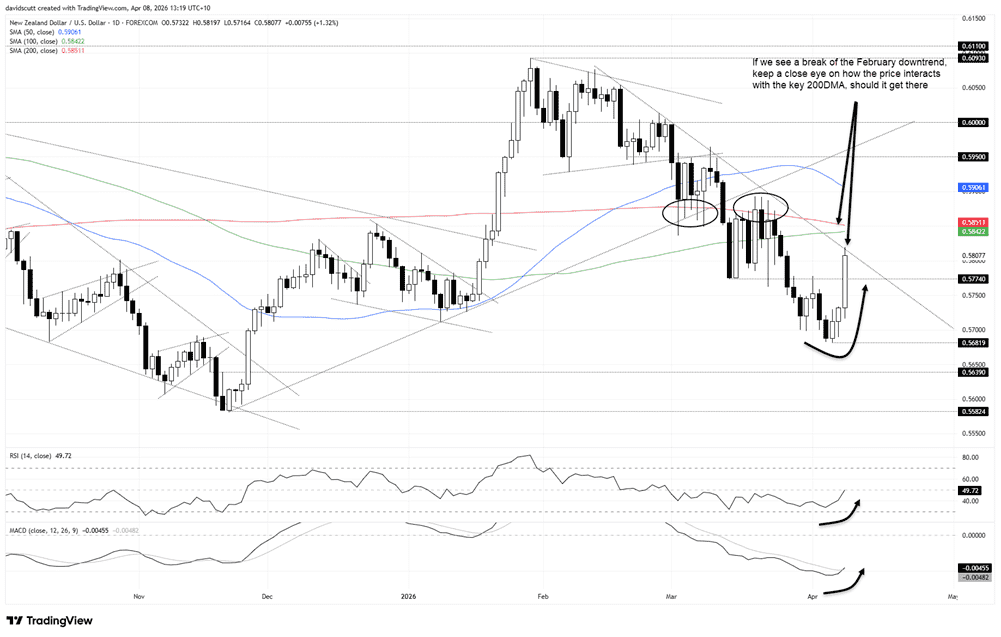
Combined with the risk-on tone in markets, the kiwi is threatening to break the downtrend it’s been in since the early stages of February. If the pair can break and close above this level, it would shift directional risks sideways to higher, although to get really excited about a trend reversal it would likely require a break above the 200DMA, a key level that capped bullish breakout attempts on numerous occasions in March.
That’s the key level to watch overhead should the downtrend break, with 0.5900, 0.5950 and 0.6000 other reference points of note.
If the downtrend holds, 0.5774 has acted as support and resistance recently, making it the first reference point on the downside.
Like the price action, the oscillators are also shifting rapidly, with RSI (14) back above 50 and trending higher while MACD has crossed the signal line from below and is now moving back towards positive territory. It’s more neutral than anything when it comes to directional risks, but the speed of change suggests they’re now starting to tilt higher overall.
Latest market news




Open an account today
Experience award-winning platforms with fast and secure execution.
Economic calendar
Web Trader platform
Our sophisticated web-based platform is packed with features.
Related articles
British Pound Short-term Outlook: GBP/USD 3% Plunge Hits 12-Month Low—Key Support in Focus 11 19 2026
Sterling’s October rebound has unraveled, leaving GBP/USD bears in control—but stretched momentum raises the stakes for the weekly close
Australian Dollar Technical Outlook: AUD/USD 6% Plunge Tests Make-or-Break Support at Yearly Low 11 19 2026
AUD/USD’s four-week decline is testing critical support, with a decisive break below this threshold needed to fuel the next major leg lower.

WTI and Dow Fall as Nasdaq Holds Its Bullish Rebound
WTI, Dow and Nasdaq Outlook: Crude oil oversupply risks, Fed rate-hike expectations, persistent geopolitical tensions and renewed interest in AI are driving market swings this week. Here are the key levels and scenarios to watch.

From time to time, StoneX Financial Pty Ltd (“we”, “our”) website may contain links to other sites and/or resources provided by third parties. These links and/or resources are provided for your information only and we have no control over the contents of those materials, and in no way endorse their content. Any analysis, opinion, commentary or research-based material on our website is for information and educational purposes only and is not, in any circumstances, intended to be an offer, recommendation or solicitation to buy or sell. You should always seek independent advice as to your suitability to speculate in any related markets and your ability to assume the associated risks, if you are at all unsure. No representation or warranty is made, express or implied, that the materials on our website are complete or accurate. We are not under any obligation to update any such material.
As such, we (and/or our associated companies) will not be responsible or liable for any loss or damage incurred by you or any third party arising out of, or in connection with, any use of the information on our website (other than with regards to any duty or liability that we are unable to limit or exclude by law or under the applicable regulatory system) and any such liability is hereby expressly disclaimed.