




Rio tie to iron set to drag
Its latest multi-billion dollar pay-out isn’t entirely welcome
Share this:

Its latest multi-billion dollar pay-out isn’t entirely welcome
Rio's decision to pump out even more cash to shareholders, on top of a yield that already surpasses FTSE 100 rivals has not pleased investors. The group also reports an £800m write-down related to its troubled Oyu Togloi project in Mongolia. Stripping out a one-off $4bn from an asset sale included with the half-year pay-out last year, the sum totalled $3.2bn. That’s less than the $3.5bn package announced on Thursday, including a $1bn special dividend.
Dependence on the steel-making metal also causes misgivings. Soaring iron ore values buoyed the interim performance, lifting underlying H1 earnings 12% to $4.93bn, comfortably above the $4.86bn average forecast. Yet at $11.6bn of consolidated sales over the six months to 30th June, iron ore constituted over half of Rio's $20.2bn total sales. Forecasts of a price a retreat abound. The futures fair value curve points below $100/MT in a year, from around $140/MT for the front-month contract on China’s Dalian Commodity Exchange right now.
Rio spending is up, with a focus on copper, though large projects are mostly at initial stages. The group itself cites "continued cost pressures...primarily reflecting an increase in iron ore unit costs.”
Rio’s shares still over-perform FTSE 100 peers so far this year. They face similar problems, but at a lower magnitude. Rio's stock could have a heavier negative bias in the second half of 2019.
Chart thoughts
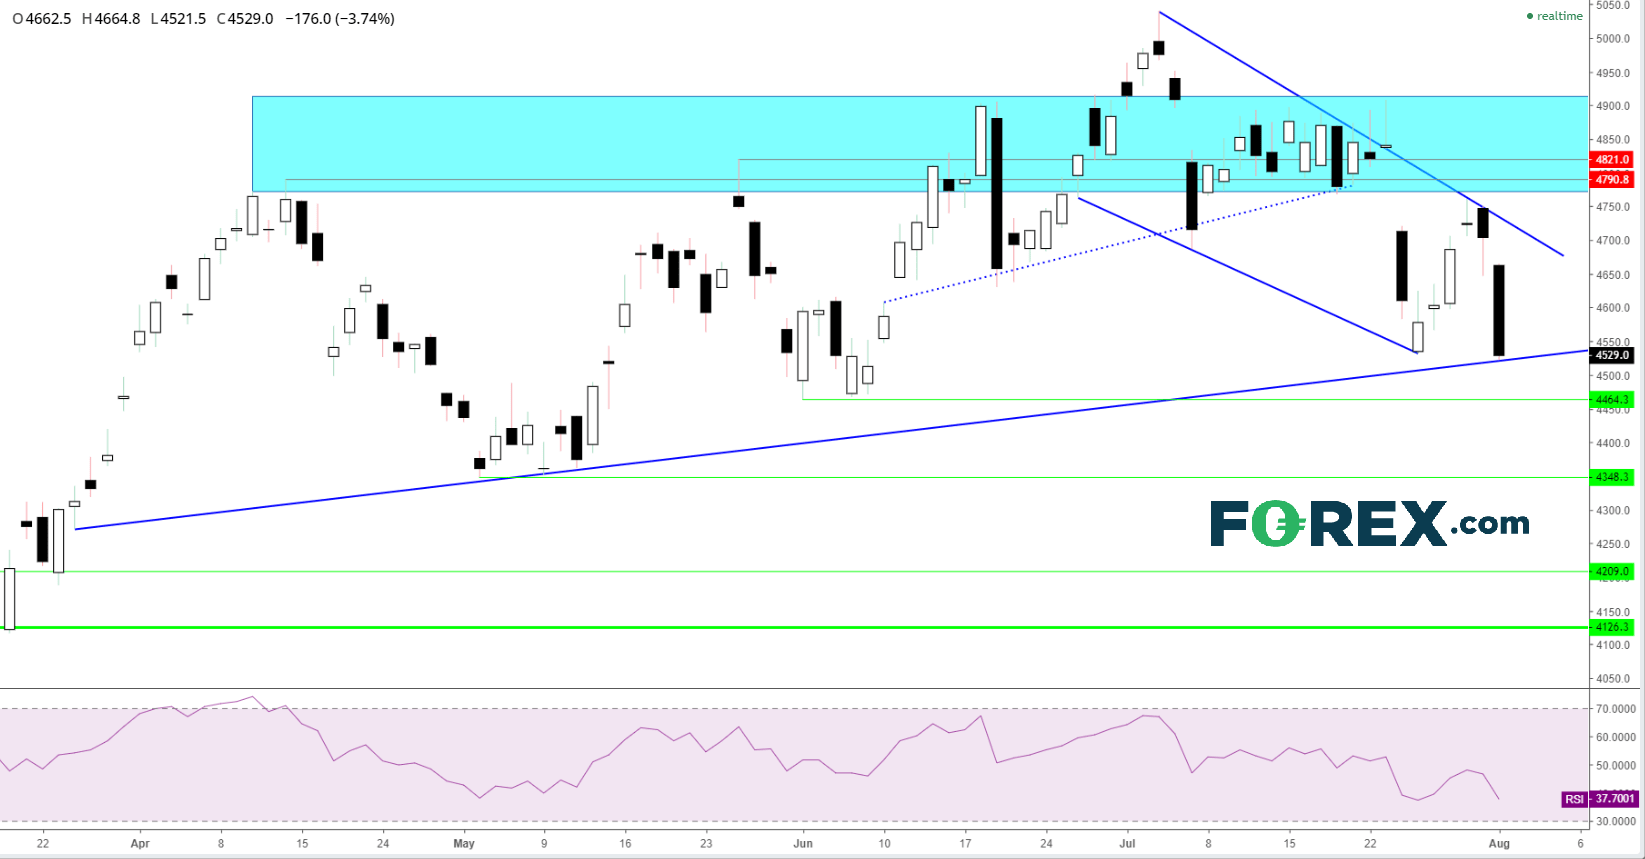
For buyers, it’s now crucial for RIO to close above its rising line since April to avoid damaging the longer trend since early 2016. The conundrum is that the cluster of failures somewhat below the years 5040p high were quite emphatic, marking out 4914p-4773p as a formidable barrier. So, any recovery at current prices will need to be solidly-founded to have a chance of progressing higher. The slump off the years high within a short channel resembles a declining flag that could certainly be a continuation pattern. So long as the trend holds. If not, sellers will be looking beyond possible support at kick back lows of 4464p and 4348. More aggressive support of 4209p and 4126p would be required if the current down leg becomes a trend
Rio Tinto CFD – daily
Source: FOREX.com
Its latest multi-billion dollar pay-out isn’t entirely welcome
Rio's decision to pump out even more cash to shareholders, on top of a yield that already surpasses FTSE 100 rivals has not pleased investors. The group also reports an £800m write-down related to its troubled Oyu Togloi project in Mongolia. Stripping out a one-off $4bn from an asset sale included with the half-year pay-out last year, the sum totalled $3.2bn. That’s less than the $3.5bn package announced on Thursday, including a $1bn special dividend.
Dependence on the steel-making metal also causes misgivings. Soaring iron ore values buoyed the interim performance, lifting underlying H1 earnings 12% to $4.93bn, comfortably above the $4.86bn average forecast. Yet at $11.6bn of consolidated sales over the six months to 30th June, iron ore constituted over half of Rio's $20.2bn total sales. Forecasts of a price a retreat abound. The futures fair value curve points below $100/MT in a year, from around $140/MT for the front-month contract on China’s Dalian Commodity Exchange right now.
Rio spending is up, with a focus on copper, though large projects are mostly at initial stages. The group itself cites "continued cost pressures...primarily reflecting an increase in iron ore unit costs.”
Rio’s shares still over-perform FTSE 100 peers so far this year. They face similar problems, but at a lower magnitude. Rio's stock could have a heavier negative bias in the second half of 2019.
Chart thoughts
For buyers, it’s now crucial for RIO to close above its rising line since April to avoid damaging the longer trend since early 2016. The conundrum is that the cluster of failures somewhat below the years 5040p high were quite emphatic, marking out 4914p-4773p as a formidable barrier. So, any recovery at current prices will need to be solidly-founded to have a chance of progressing higher. The slump off the years high within a short channel resembles a declining flag that could certainly be a continuation pattern. So long as the trend holds. If not, sellers will be looking beyond possible support at kick back lows of 4464p and 4348. More aggressive support of 4209p and 4126p would be required if the current down leg becomes a trend
Rio Tinto CFD – daily
Source: City Index
Latest market news




Open an account today
Experience award-winning platforms with fast and secure execution.
Economic calendar
Web Trader platform
Our sophisticated web-based platform is packed with features.
Related articles

ASX 200 Outlook: Potential to Bounce Sits on a Knife Edge
ASX 200 bounce prospects remain on a knife edge as oversold technicals clash with weak financials, commodity pressures and global risk aversion.

Nvidia Earnings Preview: NVDA’s First Test of the Post Jenson Huang Era
Nvidia is expected to report $2.47 in EPS on $108.8B in revenue this quarter, but investors will be more interested in the company's guidance after the unexpected departure of founder and CEO Jenson Huang.


ASX 200 Outlook: Sector Rotation Builds as Rally Nears Record High
The ASX 200 nears record highs as sector rotation gathers pace. Could the RBA be nearing peak rates, and will resistance at 9200 trigger a pullback?
From time to time, StoneX Financial Pty Ltd (“we”, “our”) website may contain links to other sites and/or resources provided by third parties. These links and/or resources are provided for your information only and we have no control over the contents of those materials, and in no way endorse their content. Any analysis, opinion, commentary or research-based material on our website is for information and educational purposes only and is not, in any circumstances, intended to be an offer, recommendation or solicitation to buy or sell. You should always seek independent advice as to your suitability to speculate in any related markets and your ability to assume the associated risks, if you are at all unsure. No representation or warranty is made, express or implied, that the materials on our website are complete or accurate. We are not under any obligation to update any such material.
As such, we (and/or our associated companies) will not be responsible or liable for any loss or damage incurred by you or any third party arising out of, or in connection with, any use of the information on our website (other than with regards to any duty or liability that we are unable to limit or exclude by law or under the applicable regulatory system) and any such liability is hereby expressly disclaimed.