


Softer US data sends US Dollar lower
If the data continues to come out weak for the US, it could mean a move dovish Fed than expected.
Share this:

When trying to determine what the Fed will do at its next meeting, there are many variables that come into play. Retail Sales inflation data and manufacturing data are a few of the most important factors. December Retail Sales showed that shoppers spent less in December as the MoM print was -1.1% vs an expectation of -0.8% and a November reading of -1.0% (revised from -0.6%). In addition, Retails Sales (ex-Autos) was also -1.1% MoM vs an expectation of -0.4% MoM and a November reading of -0.6% MoM (revised from -0.2% MoM).
US PPI was also weaker than expected. Headline PPI fell to 6.2% YoY vs an expectation of 6.8% YoY and a prior reading of 7.3% YoY (revised from 7.4% YoY). This is the lowest PPI reading since March 2021.
Adding fuel to the fire are Industrial Production and Manufacturing Production for December. Both prints were weaker than expected, suggesting that the soft-landing scenario the Fed has painted may not be so cut and dry. Industrial Production was -0.7% MoM vs an expectation of -0.1% MoM and a November reading of -0.6% MoM (revised of -0.2%). This was the biggest decline since September 2021. Manufacturing Production was also weaker at -1.3% MoM vs an expectation of -0.3% MoM and a November reading of -1.1% MoM (revised from -0.6%). This was the largest decrease in the data series since February 2021.
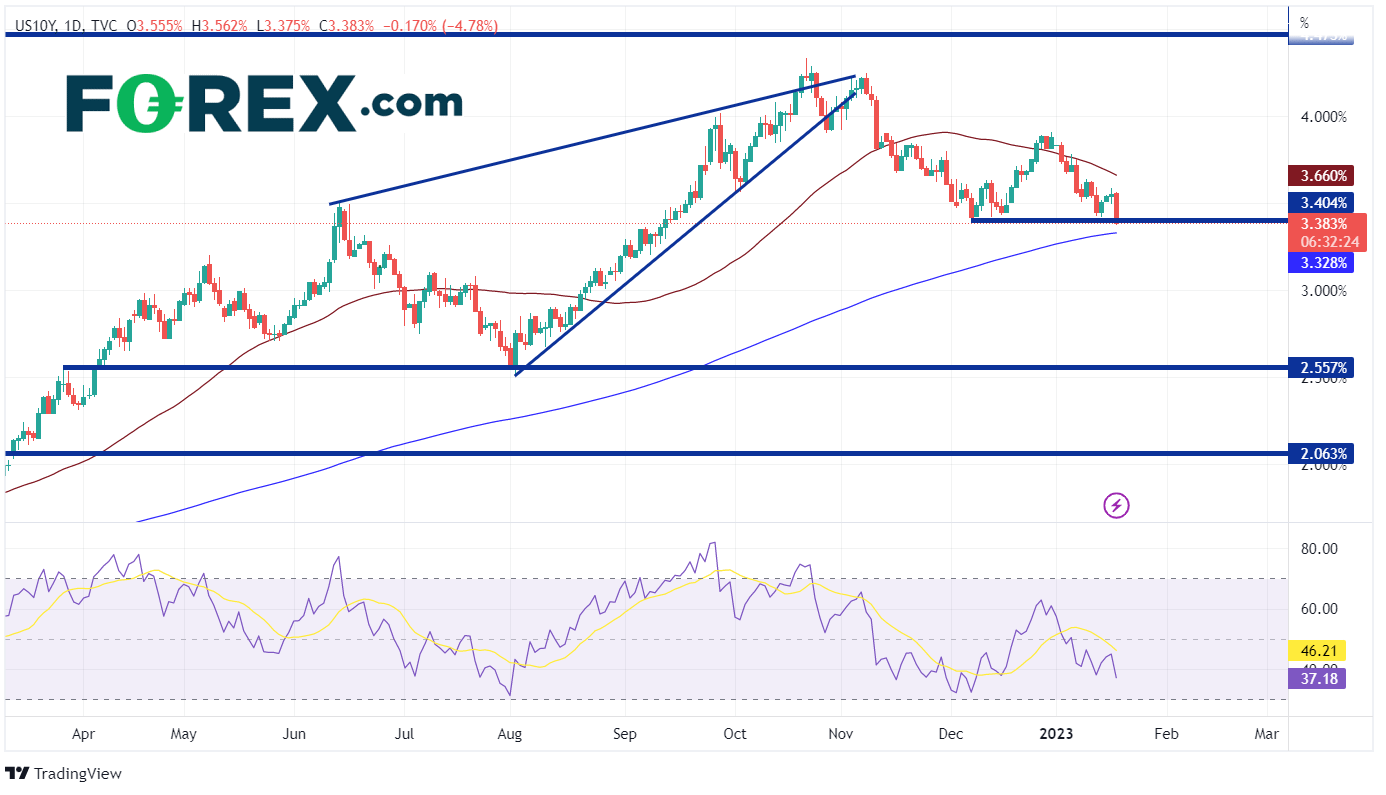
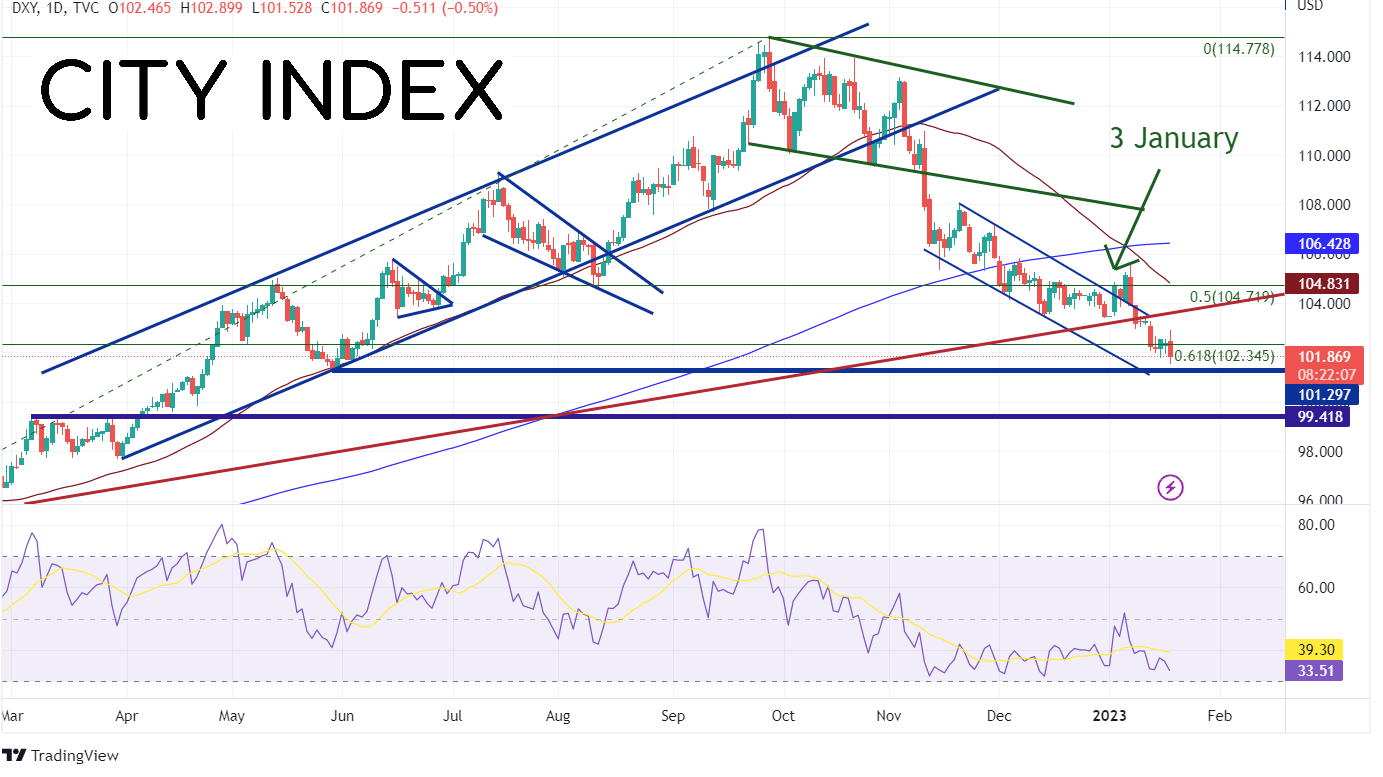
Weaker retail sales, inflation, and manufacturing data point to a more dovish Fed when it meets on February 1st. This is pushing interest rates and the US Dollar lower. US 10-year yields fell to their lowest level since mid-September 2022 at 3.375% while the DXY is closing on May 30th, 2022 support at 101.30.
US 10 Year Daily
Source: Tradingview, Stone X
DXY Daily

Source: Tradingview, Stone X
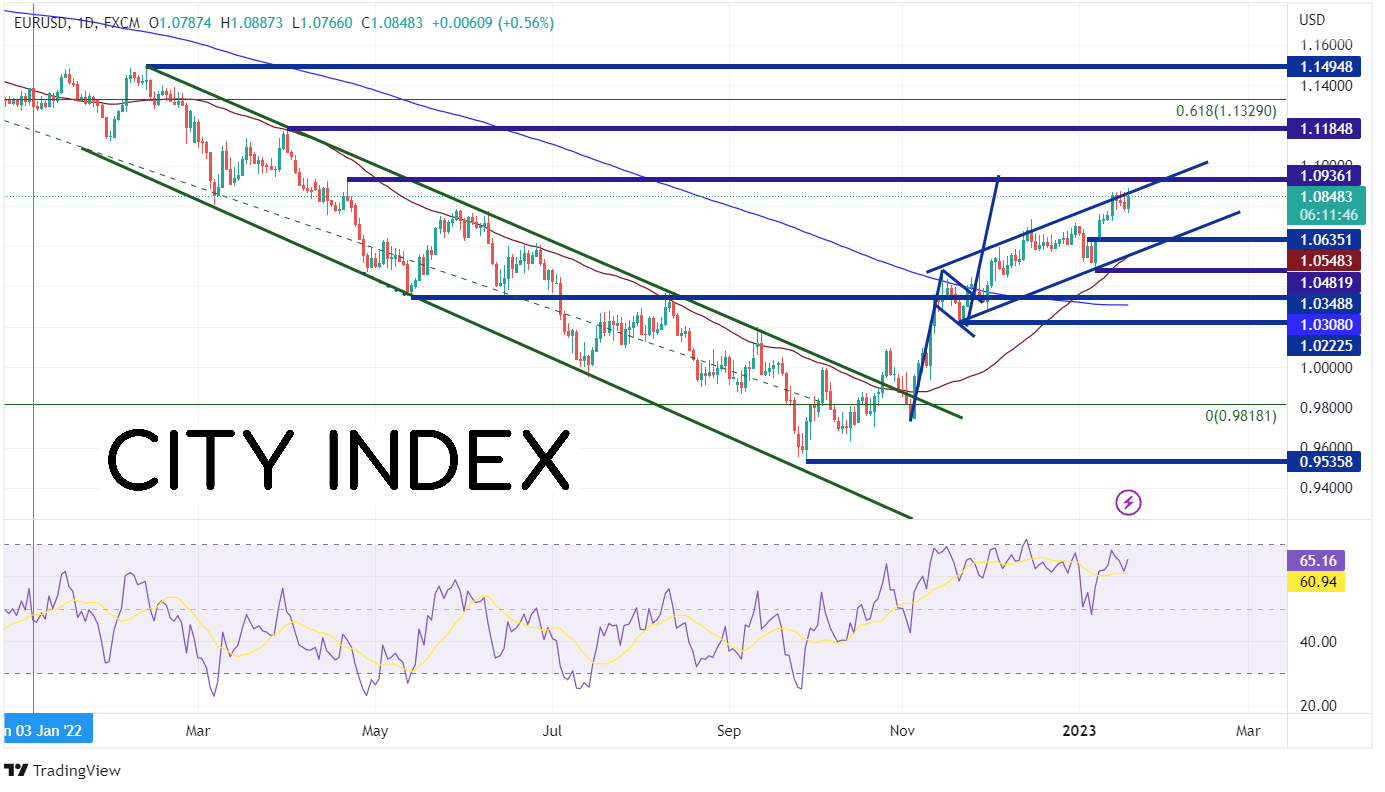
With the BOJ and UK inflation earlier today, it's best to take a look at EUR/USD, as the Eurozone didn’t have much skin in the game today. On a daily timeframe, EUR/USD reached its highest level since April 21st, 2022 as US Dollar weakness helped push the pair higher. Price is currently testing the top trendline of the channel, which began in November 2022, near 1.0865. If the US Dollar continues to weaken, the pair should remain bid. First resistance is at the highs of April 21st at 1.0936. Above there, EUR/USD can move to the highs of March 31st, 2022 at 1.1185, then the 61.8% Fibonacci retracement level from the highs of May 2021 to the lows of September 2022, at 1.1329. However, if EUR/USD pulls back, the first support is at the highs from January 4th at 1.0635. Below there, price can test a confluence of support at the 50 Day Moving Average and the bottom trendline of the channel near 1.0548. Next support is the lows of January 6th at 1.0482.

Source: Tradingview, Stone X
If the data continues to come out weak for the US, it could mean a move dovish Fed than expected on the back of weaker inflation and the possibility of a hard landing. On Thursday and Friday, the US releases housing data and the Philadelphia Fed Manufacturing Index. Manage risk accordingly.
When trying to determine what the Fed will do at its next meeting, there are many variables that come into play. Retail Sales inflation data and manufacturing data are a few of the most important factors. December Retail Sales showed that shoppers spent less in December as the MoM print was -1.1% vs an expectation of -0.8% and a November reading of -1.0% (revised from -0.6%). In addition, Retails Sales (ex-Autos) was also -1.1% MoM vs an expectation of -0.4% MoM and a November reading of -0.6% MoM (revised from -0.2% MoM).
US PPI was also weaker than expected. Headline PPI fell to 6.2% YoY vs an expectation of 6.8% YoY and a prior reading of 7.3% YoY (revised from 7.4% YoY). This is the lowest PPI reading since March 2021.
Adding fuel to the fire are Industrial Production and Manufacturing Production for December. Both prints were weaker than expected, suggesting that the soft-landing scenario the Fed has painted may not be so cut and dry. Industrial Production was -0.7% MoM vs an expectation of -0.1% MoM and a November reading of -0.6% MoM (revised of -0.2%). This was the biggest decline since September 2021. Manufacturing Production was also weaker at -1.3% MoM vs an expectation of -0.3% MoM and a November reading of -1.1% MoM (revised from -0.6%). This was the largest decrease in the data series since February 2021.
Weaker retail sales, inflation, and manufacturing data point to a more dovish Fed when it meets on February 1st. This is pushing interest rates and the US Dollar lower. US 10-year yields fell to their lowest level since mid-September 2022 at 3.375% while the DXY is closing on May 30th, 2022 support at 101.30.
US 10 Year Daily

Source: Tradingview, Stone X
DXY Daily
Source: Tradingview, Stone X
Trade the DXY now: Login or Open a new account!
• Open an account in the UK
• Open an account in Australia
• Open an account in Singapore
With the BOJ and UK inflation earlier today, it's best to take a look at EUR/USD, as the Eurozone didn’t have much skin in the game today. On a daily timeframe, EUR/USD reached its highest level since April 21st, 2022 as US Dollar weakness helped push the pair higher. Price is currently testing the top trendline of the channel, which began in November 2022, near 1.0865. If the US Dollar continues to weaken, the pair should remain bid. First resistance is at the highs of April 21st at 1.0936. Above there, EUR/USD can move to the highs of March 31st, 2022 at 1.1185, then the 61.8% Fibonacci retracement level from the highs of May 2021 to the lows of September 2022, at 1.1329. However, if EUR/USD pulls back, the first support is at the highs from January 4th at 1.0635. Below there, price can test a confluence of support at the 50 Day Moving Average and the bottom trendline of the channel near 1.0548. Next support is the lows of January 6th at 1.0482.
Source: Tradingview, Stone X
Trade EUR/USD now: Login or Open a new account!
• Open an account in the UK
• Open an account in Australia
• Open an account in Singapore
If the data continues to come out weak for the US, it could mean a move dovish Fed than expected on the back of weaker inflation and the possibility of a hard landing. On Thursday and Friday, the US releases housing data and the Philadelphia Fed Manufacturing Index. Manage risk accordingly.
Learn more about forex trading opportunities.
Related tags:
Latest market news




Open an account today
Experience award-winning platforms with fast and secure execution.
Economic calendar
Web Trader platform
Our sophisticated web-based platform is packed with features.
Related articles
British Pound Short-term Outlook: GBP/USD 3% Plunge Hits 12-Month Low—Key Support in Focus 11 19 2026
Sterling’s October rebound has unraveled, leaving GBP/USD bears in control—but stretched momentum raises the stakes for the weekly close

Nasdaq 100 forecast: Markets turn jittery as Anthropic debuts at 34% above IPO
Nasdaq futures were up some 2% earlier, but shortly after the Anthropic debut, the index slumped to session lows, down more than 1.5%, before bouncing back from the lows at the time of writing. Much of the selling for the Nasdaq was driven by AMD which slumped nearly 10% after a Hunterbrook Media report raised fresh questions about the company’s exposure to US export controls on China.

EUR/USD Rally Reverses, Dollar Strength Reigns Supreme
EUR/USD put in its first test below the 1.1000 level this week and earlier this morning buyers tried to push price back above. That has so far failed with price action threatening a fresh 19-month low.

From time to time, StoneX Financial Pty Ltd (“we”, “our”) website may contain links to other sites and/or resources provided by third parties. These links and/or resources are provided for your information only and we have no control over the contents of those materials, and in no way endorse their content. Any analysis, opinion, commentary or research-based material on our website is for information and educational purposes only and is not, in any circumstances, intended to be an offer, recommendation or solicitation to buy or sell. You should always seek independent advice as to your suitability to speculate in any related markets and your ability to assume the associated risks, if you are at all unsure. No representation or warranty is made, express or implied, that the materials on our website are complete or accurate. We are not under any obligation to update any such material.
As such, we (and/or our associated companies) will not be responsible or liable for any loss or damage incurred by you or any third party arising out of, or in connection with, any use of the information on our website (other than with regards to any duty or liability that we are unable to limit or exclude by law or under the applicable regulatory system) and any such liability is hereby expressly disclaimed.