


S&P 500 Analysis: SPX moves away from 7,000 points under pressure from Nvidia
The session continues with a consistent decline in the SPX index, down more than 1.00% in the short term, with price moving further away from the 7,000-point level. Selling pressure remains in place, partly due to the lack of a solid recovery in overall market demand and also because of weakness in key components such as Nvidia.
Share this:

The session continues with a consistent decline in the SPX index, down more than 1.00% in the short term, with price moving further away from the 7,000-point level. Selling pressure remains in place, partly due to the lack of a solid recovery in overall market demand and also because of weakness in key components such as Nvidia, which has begun weighing on the index’s short-term price action. If this generalized lack of confidence persists, selling pressure on SPX could gain further relevance in the coming trading sessions.


Nvidia weighs on the market
The outlook for the SPX has turned negative as the top five components of the index post notable declines, led by Nvidia with a drop of approximately -4.43%, followed by Apple (-0.7%), Microsoft (-0.12%), Amazon (-1.38%), and Google (-2.04%). These companies account for more than 25% of the index’s weight, meaning their movements have a significant impact on SPX’s overall performance. This reflects a consistent lack of confidence in the index’s largest constituents in the short term.
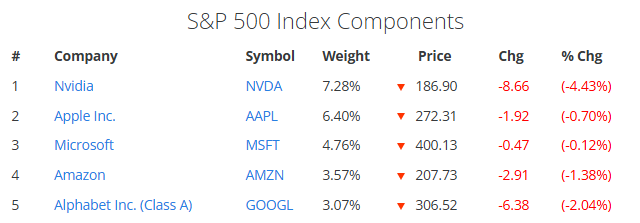
Source: Slickcharts
Part of this weakness is linked to Nvidia’s quarterly earnings released in the previous session. The company exceeded revenue expectations, reporting approximately $68 billion versus the projected $66 billion, representing growth of nearly 73% year-over-year. Earnings per share came in at $1.62, also beating expectations. In theory, these figures reflect strong performance driven by continued demand for artificial intelligence chips.
However, following the earnings release, the stock failed to sustain market confidence and began showing weakness not seen since November 2025. This may be because market expectations were already very elevated and part of the positive results had been priced in. There are also concerns related to stretched valuations and Nvidia’s dependence on capital spending by large technology companies investing in AI infrastructure. If the pace of AI investment moderates due to cost optimization efforts, it could indirectly affect Nvidia’s growth outlook.
In this context, Nvidia’s recent weakness may be contributing to broader selling pressure on the SPX. If concerns about potential overvaluation in the AI sector persist, selling pressure could remain relevant in the coming sessions.
Long-term confidence remains indecisive
Looking at broader equity market sentiment, the latest AAII Investor Sentiment Survey shows that 33.2% of participants remain bullish, 27.0% neutral, and 39.8% bearish. These figures suggest that confidence is not fully aligned to support a clearly optimistic outlook for indices such as the SPX in the coming months.
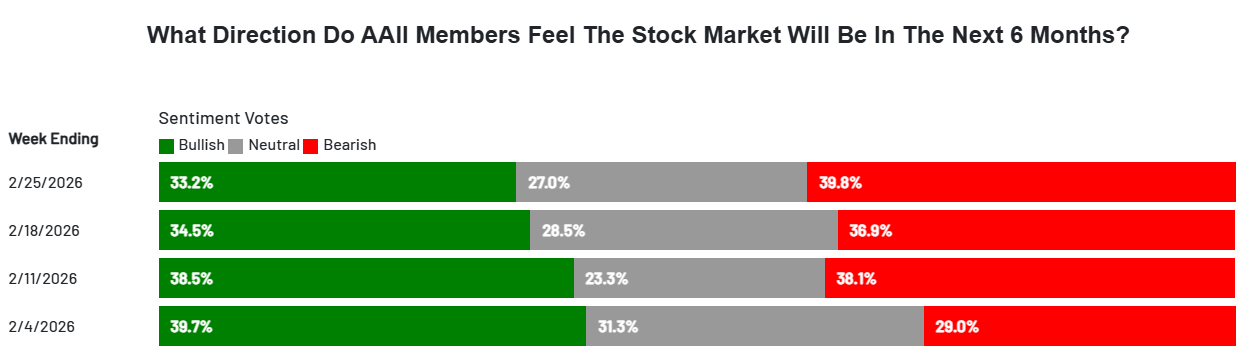
Source: AAII
If sentiment fails to improve consistently, the environment may remain unfavorable for sustaining stable demand for the SPX in the short term, potentially prolonging the current sense of weakness in the index.
Technical outlook for the S&P 500

Source: StoneX, Tradingview
- Dominant sideways range: Over recent months, the SPX has maintained a neutral bias within a range defined by resistance near 7,000 points and support around 6,700 points. This lateral channel remains the most relevant technical structure. As long as these levels hold, it will be difficult to consolidate a clear directional trend, maintaining an indecisive environment that could even favor episodes of further short-term weakness.
- RSI: The RSI is fluctuating around the neutral 50 level, indicating balance between buying and selling momentum. As long as this dynamic persists, neutrality is likely to remain dominant in the SPX.
- MACD: The MACD histogram is hovering near the zero line, reflecting equilibrium in short-term moving average strength. This condition reinforces the indecisive outlook and makes the formation of a clear trend more difficult.
Key levels:
- 7,000 points – Key resistance: Level aligned with the index’s historical highs and representing a crucial psychological barrier within the current structure. Sustained moves above this area could reactivate a more dominant buying bias and open the door to a potential short-term bullish extension.
- 6,881 points – Near-term barrier: Relevant neutrality zone aligned with the 50-period simple moving average. As long as price continues fluctuating around this level without breaking decisively away, the current sideways range could remain intact, reinforcing an indecisive scenario and limiting the development of clearer directional moves.
- 6,728 points – Key support: Level corresponding to recent significant lows and defining the lower boundary of the sideways channel. Sustained declines below this area could activate a more consistent selling dominance in the coming weeks.
Written by Julian Pineda, CFA, CMT – Market Analyst
Follow him on: @julianpineda25
Related tags:
Latest market news




Open an account today
Experience award-winning platforms with fast and secure execution.
Economic calendar
Web Trader platform
Our sophisticated web-based platform is packed with features.
Related articles
Nasdaq 100 Forecast: Anthropic Weighs on NDX Sentiment
As November approaches its end, weakening confidence around major equity benchmarks such as the Nasdaq 100 remains an important theme in financial markets. The index continues to face significant short-term weakness and, over the last two trading sessions alone, has fallen nearly 6.0%, highlighting a bearish bias that has not been this evident for several months.
S&P500 Forecast: SPX falls as Anthropic drops post IPO
U.S. stocks are trading mixed with tech leading the losses as the mood sours despite Anthropic’s record-breaking IPO yesterday, which failed to calm AI jitters and revive the AI trade.


ASX 200 On Track for Worst Week in Four Years, Raising Bear Market Fears
The ASX 200 faces its worst week in four years as falling commodities, China's economic weakness and broad-based selling threaten a deeper correction.

From time to time, StoneX Financial Pty Ltd (“we”, “our”) website may contain links to other sites and/or resources provided by third parties. These links and/or resources are provided for your information only and we have no control over the contents of those materials, and in no way endorse their content. Any analysis, opinion, commentary or research-based material on our website is for information and educational purposes only and is not, in any circumstances, intended to be an offer, recommendation or solicitation to buy or sell. You should always seek independent advice as to your suitability to speculate in any related markets and your ability to assume the associated risks, if you are at all unsure. No representation or warranty is made, express or implied, that the materials on our website are complete or accurate. We are not under any obligation to update any such material.
As such, we (and/or our associated companies) will not be responsible or liable for any loss or damage incurred by you or any third party arising out of, or in connection with, any use of the information on our website (other than with regards to any duty or liability that we are unable to limit or exclude by law or under the applicable regulatory system) and any such liability is hereby expressly disclaimed.