


USD/CAD Forecast: Breakdown deepens as Fed hike bets fade
USD/CAD is trading at its lowest level since early June as data divergence builds. Attention now shifts to US inflation and whether Fed rate hike bets continue to dwindle.
Share this:

USD/CAD opens the new week trading at its lowest level since early June, breaking lower on Friday following the release of a vastly divergent set of labour market data for July, continuing a trend seen across other economic figures over recent months.
A tale of two jobs reports
That trend was on full display again last Friday, with a soggy US payrolls report sitting in stark contrast to a blowout set of figures north of the border. US non-farm payrolls fell by 23,000 in July against expectations for an 80,000 increase, with May and June also revised down by a combined 103,000. While the unemployment rate fell to 4.1%, average hourly earnings rose just 0.1% on the month, providing little evidence that labour market conditions are bolstering domestic inflation pressures.
Canada’s report could hardly have been more different. Employment jumped by 75,100 against expectations for an increase of just 16,500, with gains split almost evenly between full-time and part-time positions. The unemployment rate also fell to 6.4%, its lowest level in two years. But relativities matter. Despite the improvement, there is still considerable slack in the Canadian labour market, while annual wage growth slowed to 3.0% from 3.7%. That suggests a meaningful reacceleration in labour-driven inflation looks unlikely near-term, especially with inflation pressures already soft, questioning the need for the Bank of Canada to hike rates by year-end.
There are also reasons to be cautious about reading too much into the US payrolls miss. July has developed a habit of producing sizeable downside surprises in recent years, with seasonal adjustment around the summer months a possible factor. Much of the weakness was also concentrated in local government education, while private payrolls increased by 30,000. That doesn’t make the report strong, but it does raise questions about how much signal should be taken from the headline decline alone.
USD/CAD keeps one eye on Fed pricing
Source: TradingView, FOREX.com
This content was created by an affiliate of FOREX.com and represents the views and opinions of the author/speakers, not the views and opinions of FOREX.com, StoneX Group Inc., or its subsidiaries. The content has not been independently reviewed by FOREX.com.
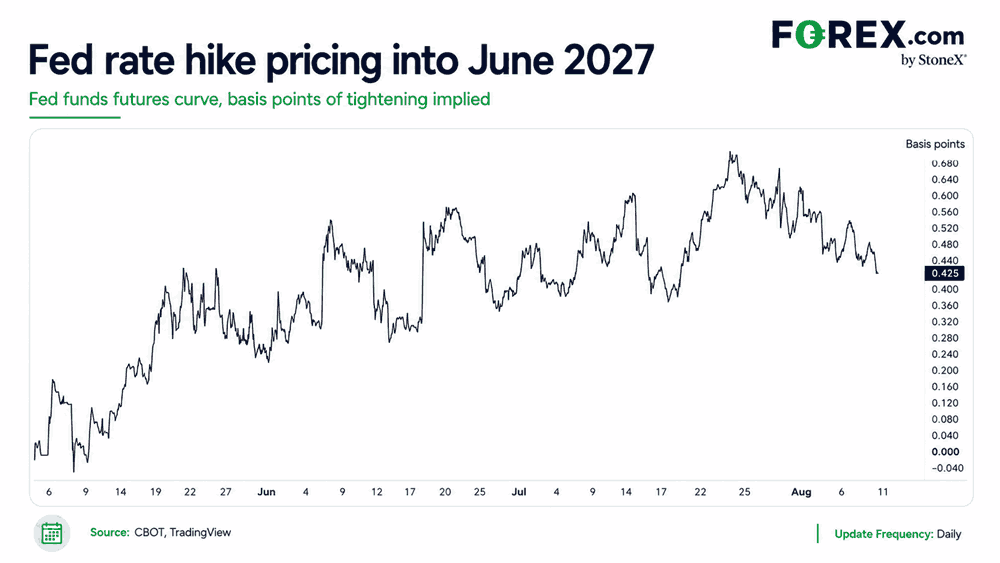
When it comes to USD/CAD, there hasn’t been an obvious underlying driver of the recent move, at least based on the various relationships I’ve looked at. But one that has been reasonably consistent is the relationship between the pair and market pricing for the Fed out to its June meeting next year. As the amount of tightening priced over that period has been whittled away, USD/CAD has moved lower.
That puts plenty of emphasis on anything capable of shifting Fed pricing from here. With the Canadian calendar very quiet this week, the main event risk comes from the US, with CPI and PPI due on Wednesday and Thursday respectively. They are the key scheduled risk events for USD/CAD traders, alongside any fresh developments on the geopolitical front.
Interestingly, energy prices have shown little consistent relationship with USD/CAD over short, medium or longer-term periods, perhaps reflecting the fact that both the US and Canada are major energy producers.
CPI and PPI to test the Fed hike case
Source: LSEG Workstation, FOREX.com
This content was created by an affiliate of FOREX.com and represents the views and opinions of the author/speakers, not the views and opinions of FOREX.com, StoneX Group Inc., or its subsidiaries. The content has not been independently reviewed by FOREX.com.
A relatively soft set of inflation figures is expected this week. Core CPI is seen rising just 0.2% on the month, which would see the annual rate slow to 2.5%. That is still above the Fed’s target and CPI is not its preferred inflation measure, but it would still be a tepid outcome given how strongly the US economy has performed relative to much of the rest of the world.
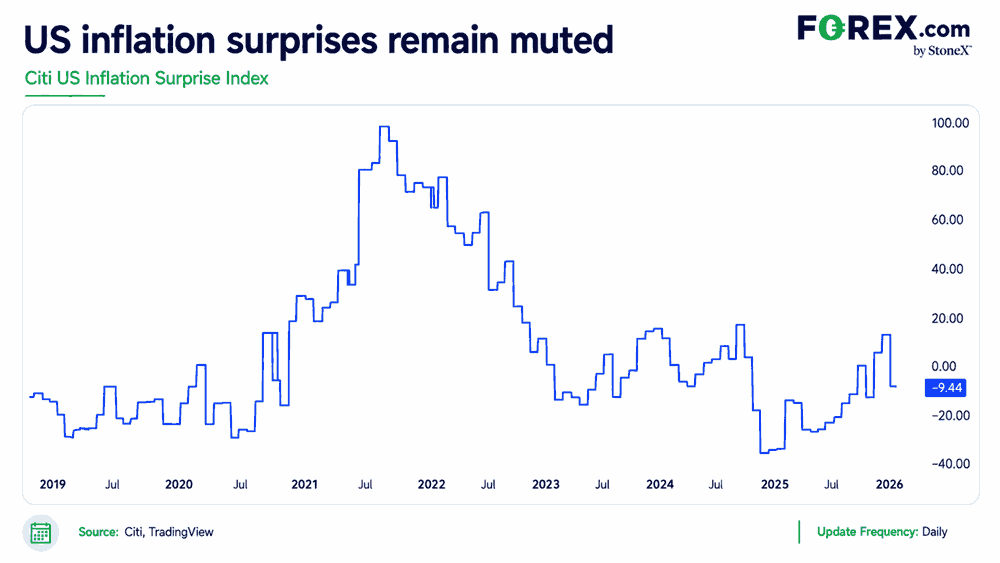
The same applies to upstream inflationary pressures. Headline PPI is expected to rise just 0.1% on the month and 3.4% over the year, with the annual rate seen slowing slightly. And looking at Citi’s US inflation surprise index above, even with the supply-driven energy shocks of recent years and some inflationary pressure stemming from the AI buildout, there have been relatively few meaningful upside surprises. By and large, inflation outcomes have either been close to expectations or undershot them.
So while the Fed is still talking about the risk of further rate hikes and markets continue to mildly favour a move in September, expectations for this week’s inflation reports are benign. Could the data come in ugly? Absolutely. But based on the trend seen in recent years, repeated upside inflation surprises have not been a feature.
Canada’s data momentum continues to improve
Source: LSEG Workstation, FOREX.com
This content was created by an affiliate of FOREX.com and represents the views and opinions of the author/speakers, not the views and opinions of FOREX.com, StoneX Group Inc., or its subsidiaries. The content has not been independently reviewed by FOREX.com.
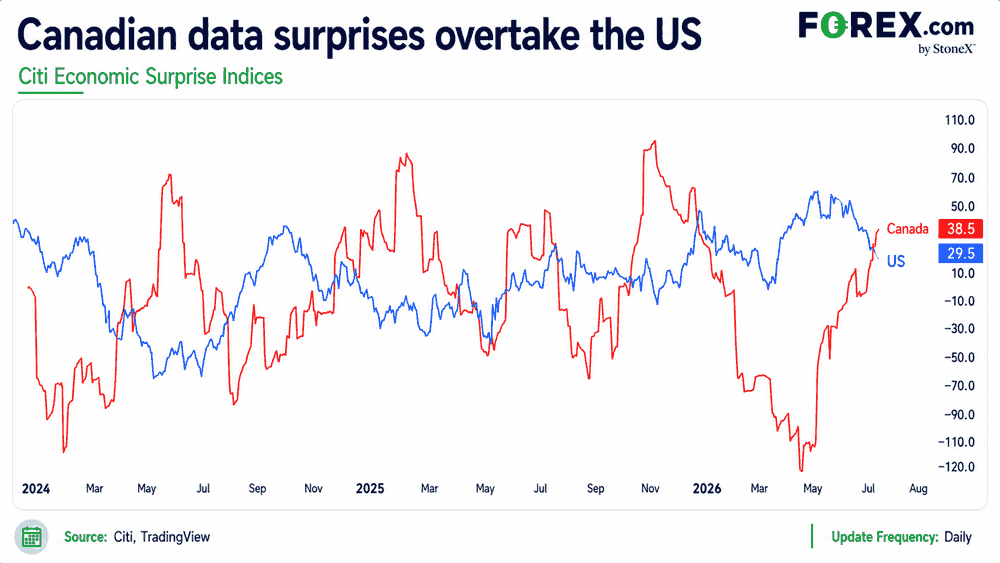
It’s not just US inflation prints that have tended to undershoot or come in close to expectations recently, but broader economic data as well. Citi’s Economic Surprise Index measures how economic releases print relative to market expectations. While the US economy is still performing strongly in absolute terms, the data have become less likely to beat expectations over recent weeks, with the index falling to its lowest level since early May.
At the same time, Canadian data have been heating up, with its surprise index moving sharply higher and overtaking the US measure for the first time since earlier this year. That relative shift has been mirrored in USD/CAD over the same period, with the pair breaking lower as the data backdrop has moved in Canada’s favour.
USD/CAD trend turns lower
Source: TradingView
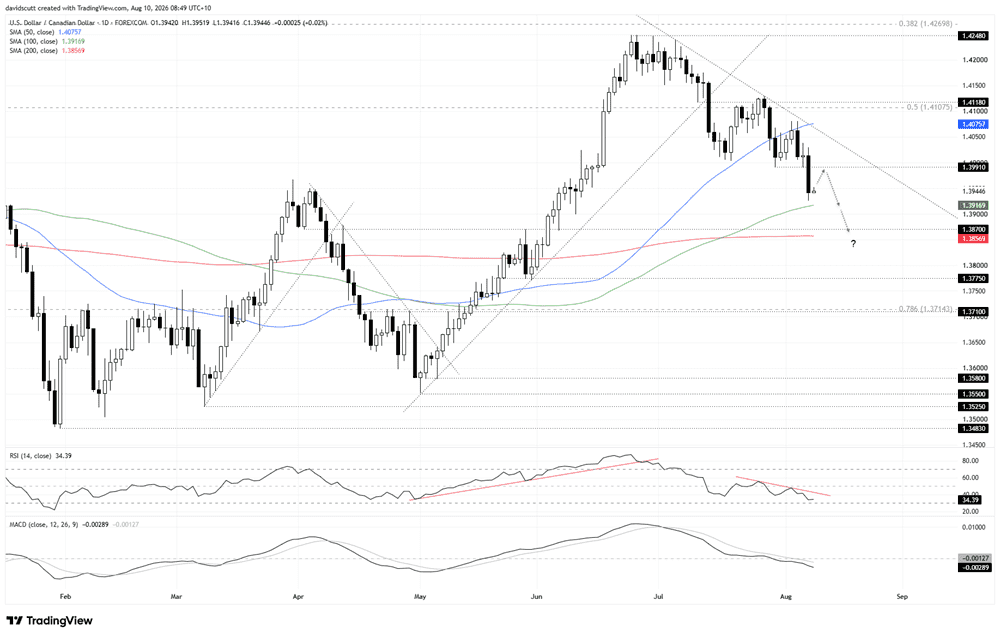
From a technical perspective, USD/CAD has established a new downtrend, highlighted by a string of lower highs and lower lows. Friday’s jobs reports delivered a break below 1.3991, with the pair now sitting just above the 100-day simple moving average.
The message from the oscillators also favours selling into strength. RSI (14) continues to trend lower, setting lower highs and lower lows, and is not yet oversold. MACD has also staged a bearish crossover and slipped into negative territory, confirming that downside momentum continues to build.
The question is whether traders want to get short at current levels after the retracement already seen, especially with question marks around the signal from the US payrolls report and major inflation data looming. There are also signs that the geopolitical situation in the Gulf is deteriorating again, which could favour broader US dollar strength. With the big dollar off its highs, that raises the risk of a mild retracement in USD/CAD ahead of Wednesday’s CPI report.
In the interim, 1.3950 is worth watching. The pair has spent plenty of time either side of it this year, making it a useful near-term pivot for those looking at short-term setups. My preference would be to see a move back towards former support at 1.3991, and then watch how the price behaves. A clear rejection would suggest that former support has flipped to resistance, creating a more appealing setup for shorts, allowing for a tight stop to be placed above.
On the downside, the 100-day moving average is the first target, followed by 1.3870, which has acted as both support and resistance on several occasions this year. The 200-day moving average sits just beneath, making that broader area an obvious target zone for shorts. Beyond there, 1.3775 is a minor support level, before a much more important zone kicks in around 1.3710. It acted as resistance earlier this year and lines up with the 78.6% Fib retracement of the September 2024 to February 2025 bull move.
On the topside, a break back above 1.3991 into the low 1.40s would start to question the bearish bias, opening the risk of a retest of the minor downtrend from the July highs, currently found around 1.4070. That also lines up with the 50-day simple moving average, which the price has respected frequently in recent months. A clean break above that downtrend would break the sequence of lower highs and raise the risk of a resumption of the prior bullish trend.
Latest market news




Open an account today
Experience award-winning platforms with fast and secure execution.
Economic calendar
Web Trader platform
Our sophisticated web-based platform is packed with features.
Related articles
Gold and Silver's Deepening Dollar Dilemma
The dollar has broken higher, gold and silver have been crushed, and US financial conditions are tightening rapidly. Our historical analysis suggests this is no ordinary precious metals selloff.
British Pound Short-term Outlook: GBP/USD 3% Plunge Hits 12-Month Low—Key Support in Focus 11 19 2026
Sterling’s October rebound has unraveled, leaving GBP/USD bears in control—but stretched momentum raises the stakes for the weekly close

Nasdaq 100 forecast: Markets turn jittery as Anthropic debuts at 34% above IPO
Nasdaq futures were up some 2% earlier, but shortly after the Anthropic debut, the index slumped to session lows, down more than 1.5%, before bouncing back from the lows at the time of writing. Much of the selling for the Nasdaq was driven by AMD which slumped nearly 10% after a Hunterbrook Media report raised fresh questions about the company’s exposure to US export controls on China.

From time to time, StoneX Financial Pty Ltd (“we”, “our”) website may contain links to other sites and/or resources provided by third parties. These links and/or resources are provided for your information only and we have no control over the contents of those materials, and in no way endorse their content. Any analysis, opinion, commentary or research-based material on our website is for information and educational purposes only and is not, in any circumstances, intended to be an offer, recommendation or solicitation to buy or sell. You should always seek independent advice as to your suitability to speculate in any related markets and your ability to assume the associated risks, if you are at all unsure. No representation or warranty is made, express or implied, that the materials on our website are complete or accurate. We are not under any obligation to update any such material.
As such, we (and/or our associated companies) will not be responsible or liable for any loss or damage incurred by you or any third party arising out of, or in connection with, any use of the information on our website (other than with regards to any duty or liability that we are unable to limit or exclude by law or under the applicable regulatory system) and any such liability is hereby expressly disclaimed.