



USD/CAD Spikes Ahead of US CPI As Trump Ends Trade Talks with Canada
USD/CAD rose after Trump ended trade talks with Canada, as traders priced in renewed tensions ahead of key US inflation data.
Share this:

USD/CAD Rises After Trump Ends Canada Trade Talks
Currency markets were largely treading water during Asian trade ahead of today’s highly anticipated US inflation figures — until President Trump announced via Truth Social that he had terminated trade talks with Canada, in response to what he described as a fraudulent Canadian advert featuring former US President Ronald Reagan criticising tariffs.
View related analysis:
View related analysis:
“Based on their egregious behavior, ALL TRADE NEGOTIATIONS WITH CANADA ARE HEREBY TERMINATED.” Trump via Truth Social
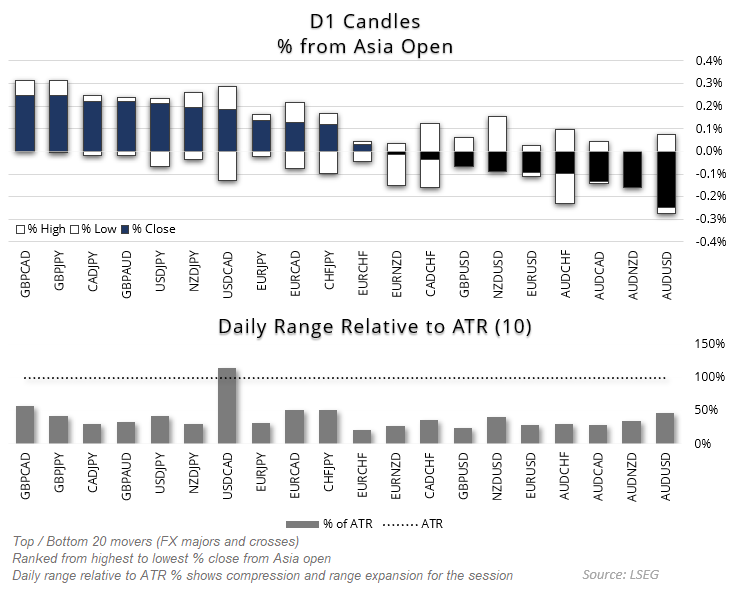
Chart analysis by Matt Simpson - Source: LSEG
The advert in question was launched by the province of Ontario (Canada) and uses a 1987 speech by Ronald Reagan in which he warned that “high tariffs inevitably lead to retaliation by foreign countries … businesses and industries shut down, and millions of people lose their jobs”.
USD/CAD spiked around 50 pips in the minutes that followed, as traders bet that renewed tensions between the US and Canada were a net negative for the Canadian dollar versus the US dollar. While the loonie also slipped slightly against the British pound and euro, the broader impact remains limited at this stage. Notably, USD/CAD was the only major pair to exceed its daily ATR (average true range) — a rare event, especially ahead of a key US inflation release.


USD/CAD Technical Analysis: US Dollar vs Canadian Dollar
The 1-hour chart shows that prices accelerated higher following Trump’s latest trade announcement, after establishing a double bottom around the weekly S1 pivot point at 1.3975.
On the daily chart, USD/CAD remains in a firm uptrend, having recently found support at its 20-day EMA. Should prices close the week near current levels, a three-bar bullish reversal pattern (morning star) would have formed.
With US CPI data still to come, however, it seems unlikely the pair will settle exactly here. A stronger-than-expected CPI print would likely see USD/CAD extend higher towards 1.41, confirming a breakout from the bullish flag on the daily chart. The flag target sits near 1.4123, with 1.4080 and 1.41 acting as interim resistance levels.
Even if CPI comes in softer, it’s hard to make a convincing bearish case for USD/CAD given the latest trade developments. Dips are therefore likely to be viewed as buying opportunities over the near term.
Only a particularly weak inflation reading, triggering a broad US dollar sell-off, would put 1.3975 at risk. A break beneath that level would expose a deeper retracement towards the high-volume node (HVN) around 1.3948.
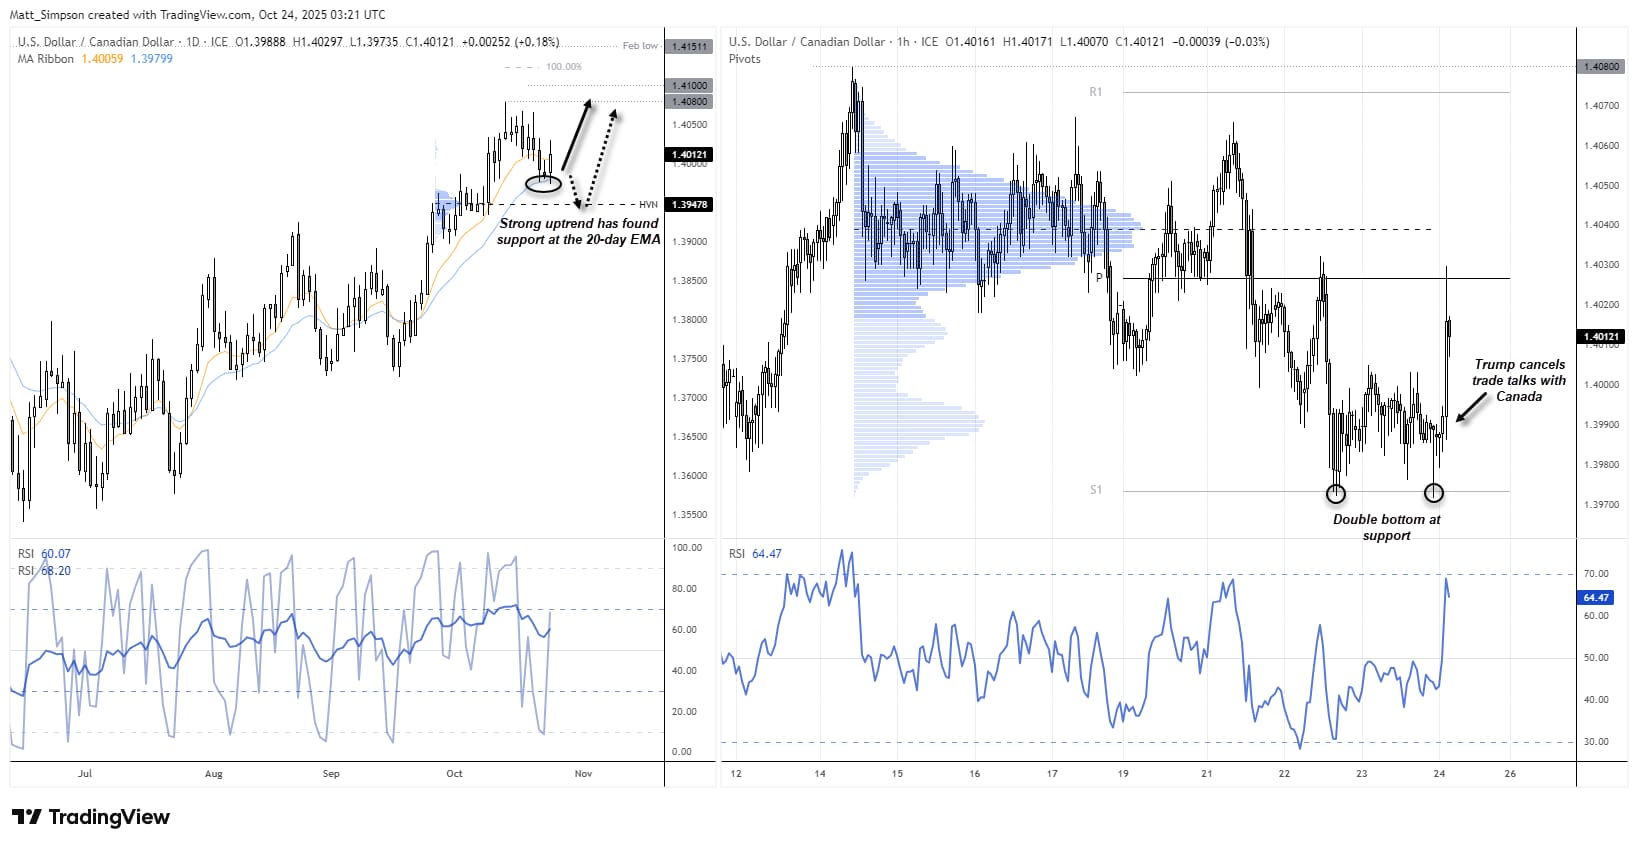
Chart analysis by Matt Simpson - data source: TradingView USD/CAD
View the full economic calendar
View the full economic calendar
-- Written by Matt Simpson
Follow Matt on Twitter @cLeverEdge
How to trade with City Index
You can trade with City Index by following these four easy steps:
- Open an account, or log in if you’re already a customer
• Open an account in the UK
• Open an account in Australia
• Open an account in Singapore
- Search for the market you want to trade in our award-winning platform
- Choose your position and size, and your stop and limit levels
- Place the trade
Related tags:


Open an account today
Experience award-winning platforms with fast and secure execution.
Economic calendar
Web Trader platform
Our sophisticated web-based platform is packed with features.
Related articles

USD/JPY Weekly Outlook: Yen Carry Unwind Risks Flash Red
A historic Nasdaq 100 selloff has revived fears of a disorderly yen carry trade unwind. Yet futures positioning, options pricing and Thanksgiving seasonality suggest the biggest threat to USD/JPY could come from the Fed itself.


US Dollar Freight Train Drives EUR/USD, GBP/USD to Fresh Lows
A hawkish Fed and growing jitters around AI have pushed a continued rally in the Greenback, and there’s not yet an end in sight.


Japanese Yen Forecast: USD/JPY Bulls Falter at Major Resistance—Critical Range Break in Focus 11 20 2026
USD/JPY’s latest retreat puts the September recovery under scrutiny, with nearby support offering bulls their next opportunity to respond.
From time to time, StoneX Financial Pty Ltd (“we”, “our”) website may contain links to other sites and/or resources provided by third parties. These links and/or resources are provided for your information only and we have no control over the contents of those materials, and in no way endorse their content. Any analysis, opinion, commentary or research-based material on our website is for information and educational purposes only and is not, in any circumstances, intended to be an offer, recommendation or solicitation to buy or sell. You should always seek independent advice as to your suitability to speculate in any related markets and your ability to assume the associated risks, if you are at all unsure. No representation or warranty is made, express or implied, that the materials on our website are complete or accurate. We are not under any obligation to update any such material.
As such, we (and/or our associated companies) will not be responsible or liable for any loss or damage incurred by you or any third party arising out of, or in connection with, any use of the information on our website (other than with regards to any duty or liability that we are unable to limit or exclude by law or under the applicable regulatory system) and any such liability is hereby expressly disclaimed.