



USD/CNH Break Lower Could Target 7.0000
A descending triangle pattern is tightening its grip on USD/CNH. Will the next move be a sharp break toward 7.0000?
Share this:

- USD/CNH coiling near 7.1000 support
- Bearish momentum building, MACD confirms
- Break could target 7.0000 on triangle height
Summary
Is a possible reset in relations between the world’s two most powerful nations about to see the Chinese yuan strengthen sharply? USD/CNH is coiling in a descending triangle formation, and the risk of a break lower is arguably increasing—even if the reset proves short-lived.
USD/CNH Bears Eye Deeper Downside Move
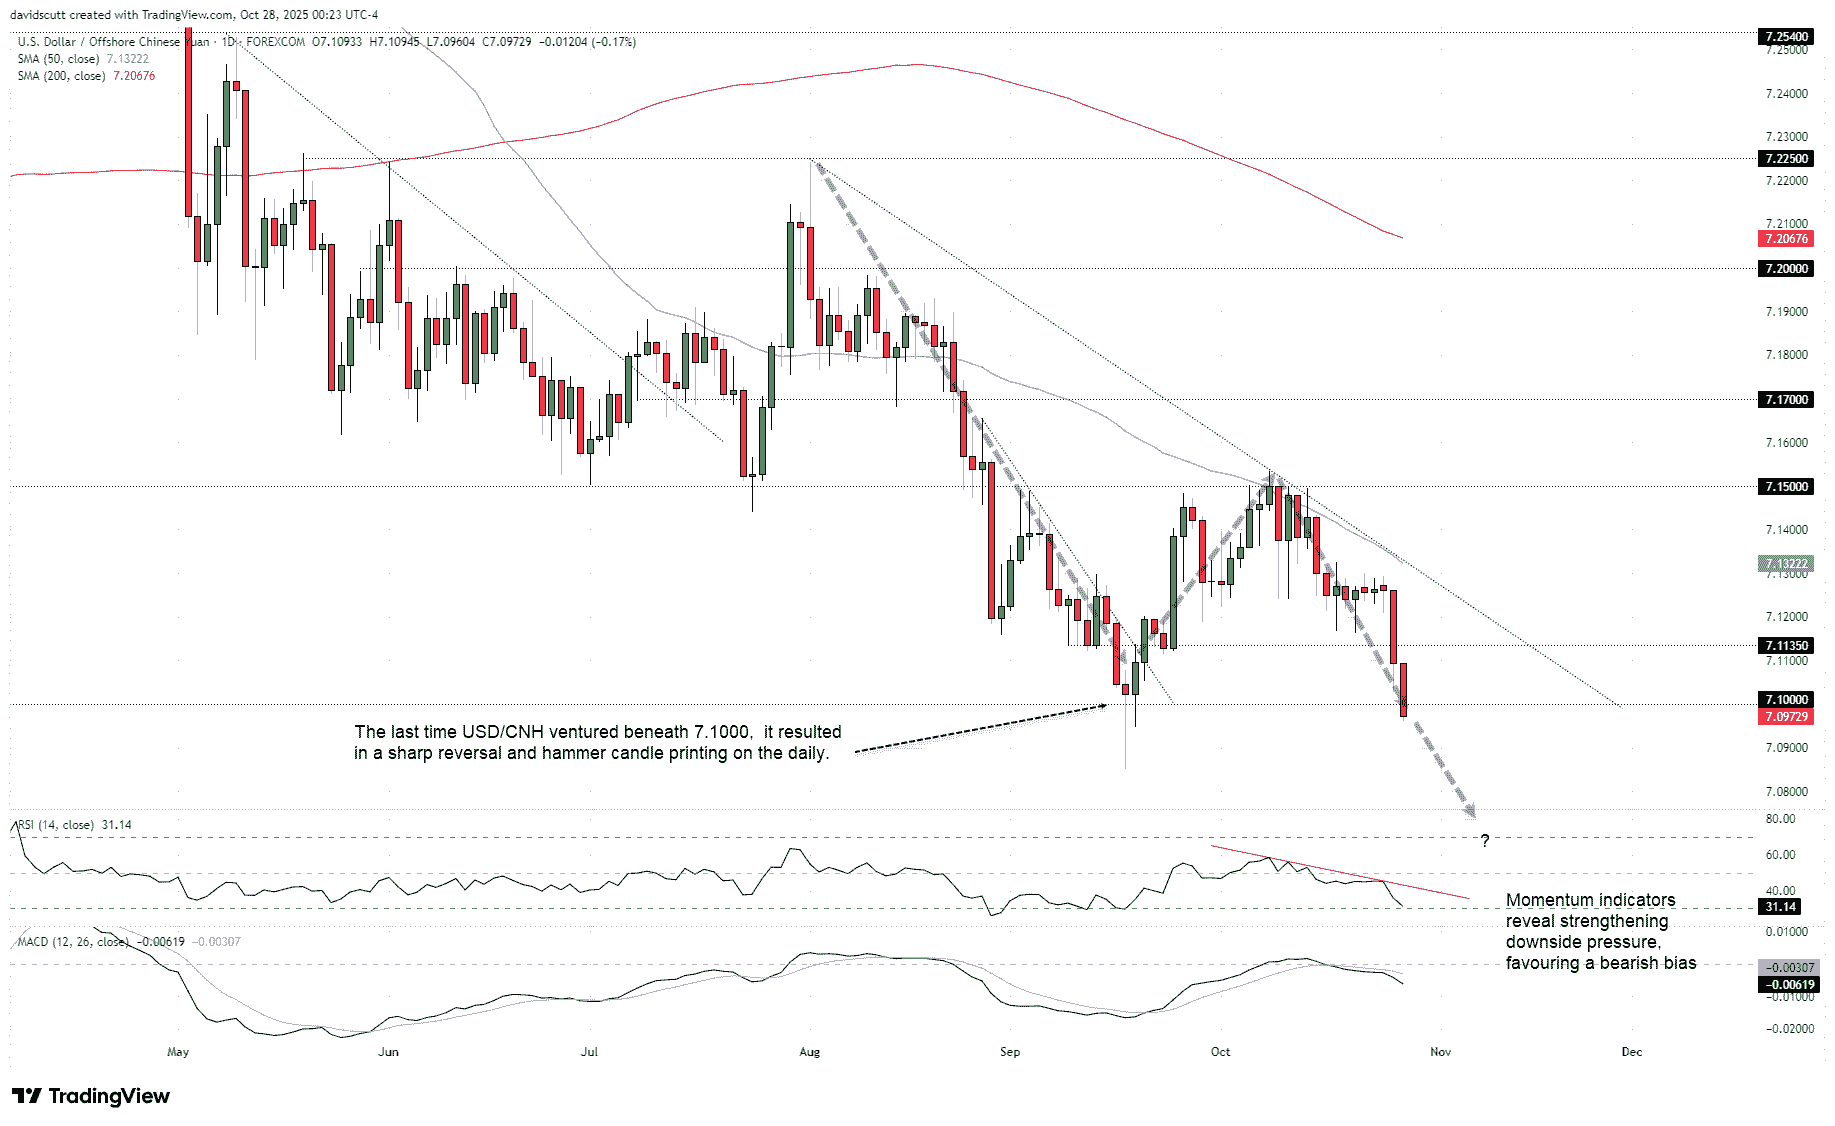
After breaking beneath the 50-day moving average on August 28, USD/CNH tried twice to reclaim the level earlier this month but failed to sustain the move. The pair has since resumed its push lower, leaving it teetering on support at 7.1000 today. The last time USD/CNH attempted to break beneath this level, it triggered a sharp reversal, printing a hammer candle on the daily chart that marked the start of a squeeze higher.
While that move failed, this one may have more success, arriving just before a likely trade deal between the U.S. and China on the sidelines of the APEC summit in South Korea later this week. There’s always the risk the framework reached on the weekend could unravel quickly, but the backdrop screens as supportive for the yuan: the Fed is widely expected to cut rates again while retaining a dovish bias, and risk appetite is strong across Asia.
Source: TradingView
Given the triangle pattern, a close beneath 7.1000 may spark a fresh wave of selling, putting the pair on track for a possible move toward the psychologically important 7.0000 level, based on the height of the triangle.
Shorts could be considered below 7.1000 with a stop above, targeting the September 17 low of 7.0850 initially. Beneath that, price action at 7.0600 and 7.0400 may provide clues as to whether the ultimate target of 7.0000 is likely to be reached.
Momentum indicators are generating strengthening bearish signals. RSI (14) is trending lower below 50 but is not yet oversold. MACD has confirmed by staging a bearish crossover of the signal line in negative territory, indicating downside pressure is building.


Related tags:
Latest market news




Open an account today
Experience award-winning platforms with fast and secure execution.
Economic calendar
Web Trader platform
Our sophisticated web-based platform is packed with features.
Related articles
Euro Short-term Outlook: EUR/USD Plunges to 19-Month Low—Bears Face Critical Test 11 18 2026
The Euro selloff is now approaching pivotal support, raising the prospect of downside exhaustion as the November decline extends.

Copper forecast: risk-off mood and demand worries sink prices below $6
Copper has broken below $6, its 200-day moving average and a trend line dating back to August 2025. With industrial metals under pressure and the dollar firm, $5.50 is now the level to watch.


Japanese Yen Technical Outlook: USD/JPY Rally Stalls Near 160—Breakout Support in Focus 11 18 2026
USD/JPY has set its weekly range just above former resistance, with a range break likely to determine whether November’s rally has further to run.
From time to time, StoneX Financial Pty Ltd (“we”, “our”) website may contain links to other sites and/or resources provided by third parties. These links and/or resources are provided for your information only and we have no control over the contents of those materials, and in no way endorse their content. Any analysis, opinion, commentary or research-based material on our website is for information and educational purposes only and is not, in any circumstances, intended to be an offer, recommendation or solicitation to buy or sell. You should always seek independent advice as to your suitability to speculate in any related markets and your ability to assume the associated risks, if you are at all unsure. No representation or warranty is made, express or implied, that the materials on our website are complete or accurate. We are not under any obligation to update any such material.
As such, we (and/or our associated companies) will not be responsible or liable for any loss or damage incurred by you or any third party arising out of, or in connection with, any use of the information on our website (other than with regards to any duty or liability that we are unable to limit or exclude by law or under the applicable regulatory system) and any such liability is hereby expressly disclaimed.