




USD/CNH: Testing 7.3000 as Yuan Faces Fresh Tariff Headwinds
Back-to-back U.S. tariffs on Chinese imports have put the yuan under pressure, fueling a bullish USD/CNH breakout. But after briefly topping 7.3000, the pair has pulled back, hinting at possible intervention from Beijing. Will resistance hold, or is another attempt to set fresh record highs on the cards?
Share this:

- Trump doubles China tariffs to 20%, on top of existing levies
- PBoC fixes yuan stronger, pushing back against market pressure
- USD/CNH tests 7.3000, with momentum signals favouring upside
Summary
An additional 10% tariff on Chinese imports entering the United States has put the Chinese yuan on the back foot against the U.S. dollar, accelerating the USD/CNH bullish breakout that began earlier this week. However, after briefly pushing above the key 7.3 level in early Asian trade, the yuan has since pared losses, suggesting Chinese authorities may be stepping in to prevent a deeper slide.
10 Plus 10
U.S. President Donald Trump announced the new tariffs starting March 4, doubling the existing duty imposed earlier in the month. He linked the move to China’s role in the fentanyl trade, arguing that cartels use Chinese components to manufacture the drug smuggled into the U.S.—a claim China disputes.
The unexpected escalation in trade tensions raises the risk of a stronger retaliatory response from Beijing, beyond the measures announced earlier this month.
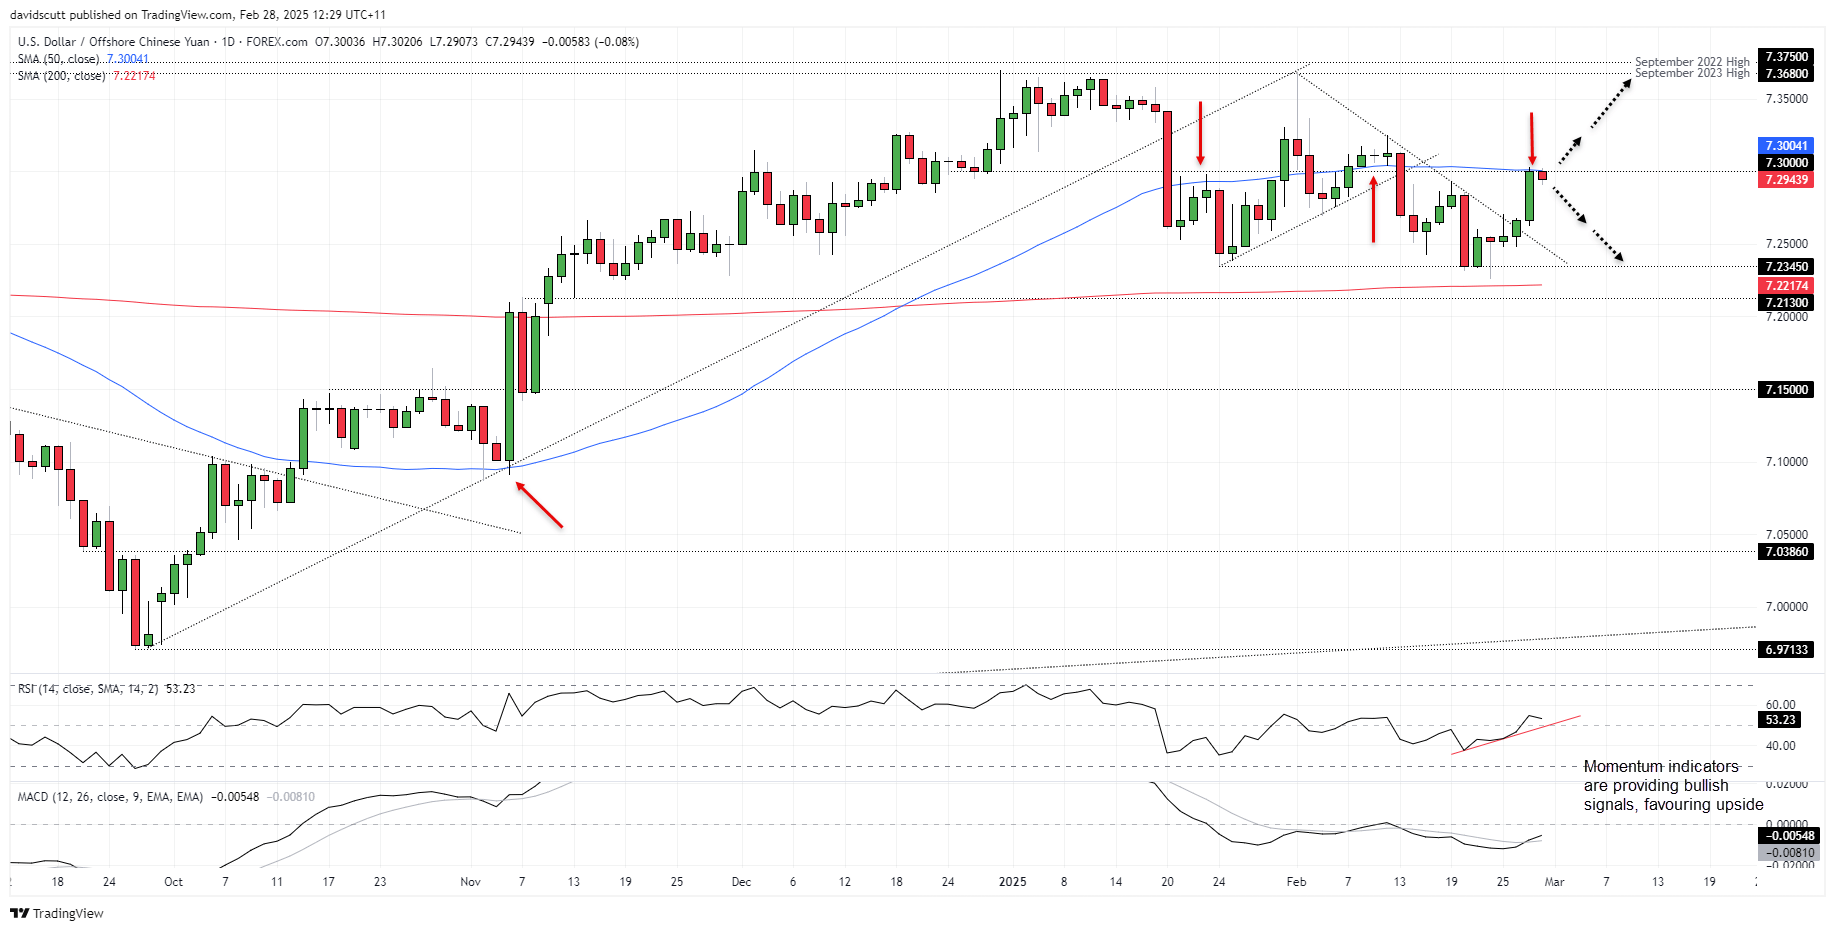
USD/CNH Bullish Break Stalls at 7.3000
Source: TradingView
As seen throughout Trump’s presidential campaign and return to office, the yuan weakened on the news, pushing USD/CNH toward key resistance at 7.3000. For now, that level is holding firm, aided by the PBoC fixing Friday’s onshore yuan midpoint at 7.1738, well below the 7.2873 level implied by market forces.
With the 50-day moving average near 7.3000, this level carries technical significance, offering a setup for fresh trades depending on price action. RSI (14) and MACD continue to signal bullish momentum, favouring further upside.
A break above 7.3000 and 50DMA could open the door for longs targeting a retest of the February 12 high around 7.3250, with 7.3750 after that. A stop below 7.3000 would provide protection. Conversely, if 7.3000 continues to cap gains, the setup could be flipped. USD/CNH did some work around 7.2700 earlier this month, making it an area of interest, with more substantial support seen near 7.2345.
-- Written by David Scutt
Follow David on Twitter @scutty
How to trade with City Index
You can trade with City Index by following these four easy steps:
- Open an account, or log in if you’re already a customer
• Open an account in the UK
• Open an account in Australia
• Open an account in Singapore
- Search for the market you want to trade in our award-winning platform
- Choose your position and size, and your stop and limit levels
- Place the trade
Related tags:
Latest market news




Open an account today
Experience award-winning platforms with fast and secure execution.
Economic calendar
Web Trader platform
Our sophisticated web-based platform is packed with features.
Related articles
Gold and Silver's Deepening Dollar Dilemma
The dollar has broken higher, gold and silver have been crushed, and US financial conditions are tightening rapidly. Our historical analysis suggests this is no ordinary precious metals selloff.
British Pound Short-term Outlook: GBP/USD 3% Plunge Hits 12-Month Low—Key Support in Focus 11 19 2026
Sterling’s October rebound has unraveled, leaving GBP/USD bears in control—but stretched momentum raises the stakes for the weekly close

Nasdaq 100 forecast: Markets turn jittery as Anthropic debuts at 34% above IPO
Nasdaq futures were up some 2% earlier, but shortly after the Anthropic debut, the index slumped to session lows, down more than 1.5%, before bouncing back from the lows at the time of writing. Much of the selling for the Nasdaq was driven by AMD which slumped nearly 10% after a Hunterbrook Media report raised fresh questions about the company’s exposure to US export controls on China.

From time to time, StoneX Financial Pty Ltd (“we”, “our”) website may contain links to other sites and/or resources provided by third parties. These links and/or resources are provided for your information only and we have no control over the contents of those materials, and in no way endorse their content. Any analysis, opinion, commentary or research-based material on our website is for information and educational purposes only and is not, in any circumstances, intended to be an offer, recommendation or solicitation to buy or sell. You should always seek independent advice as to your suitability to speculate in any related markets and your ability to assume the associated risks, if you are at all unsure. No representation or warranty is made, express or implied, that the materials on our website are complete or accurate. We are not under any obligation to update any such material.
As such, we (and/or our associated companies) will not be responsible or liable for any loss or damage incurred by you or any third party arising out of, or in connection with, any use of the information on our website (other than with regards to any duty or liability that we are unable to limit or exclude by law or under the applicable regulatory system) and any such liability is hereby expressly disclaimed.