



Gold’s rally pauses for breath: Asian Open – 17th July 2023
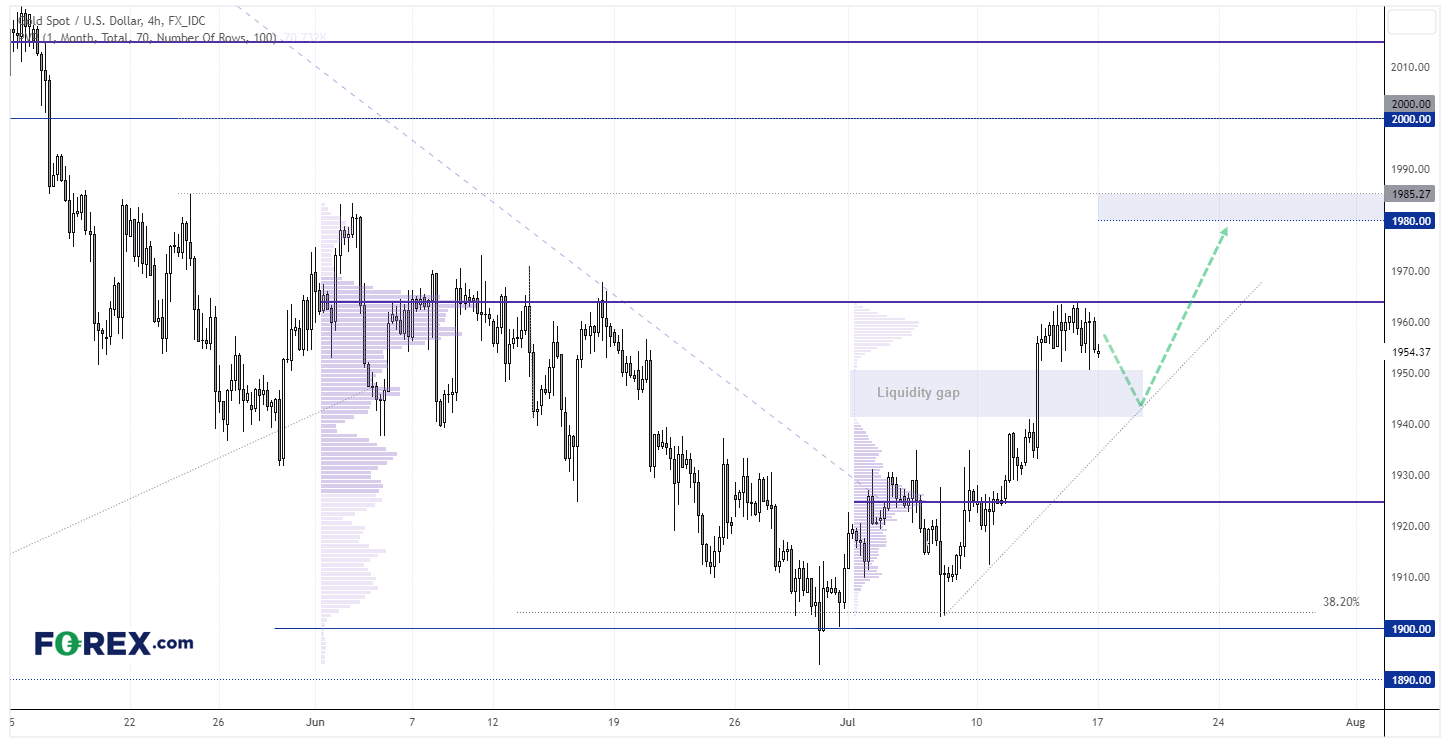
Gold looks set to retrace against some of its recent gains and potentially try to fill a liquidity gap we have identified between 1940 – 1950. Further out the bias remains bullish on gold.
Share this:

Market Summary:
- US banking stocks posted positive earnings overall on Friday, although the lack of any noteworthy reaction suggests good earnings were already baked into the cake
- The S&P 500 and Nasdaq pulled back from their multi-month highs in what appears to be technical selling ahead of the weekend following an extended bullish run
- US consumer sentiment rose to a 2-year high according to the Michigan consumer sentiment survey, which adds to hopes that the economy can avoid a recession
- And this saw the US dollar strengthen on Friday and become the strongest FX major of the day, although it was the weakest FX major of the week
- Large speculators flipped to net-short exposure to NZD futures according to last week’s COT report (commitment of traders).
- Australia’s Treasury Secretary Jim Chalmers warned that Australia’s unemployment rate is likely to rise due to higher interest rates and slower global growth
- US import prices continued to decline according to a report on Friday, which saw prices contract -0.2% in June or -6.1% y/y (which is good for hopes of lower inflation)
Events in focus (AEDT):
- 12:00 - China data dump (GDP, investment, industrial production, retail sales, unemployment, NBS press conference)
- 22:30 – NY Fed Manufacturing
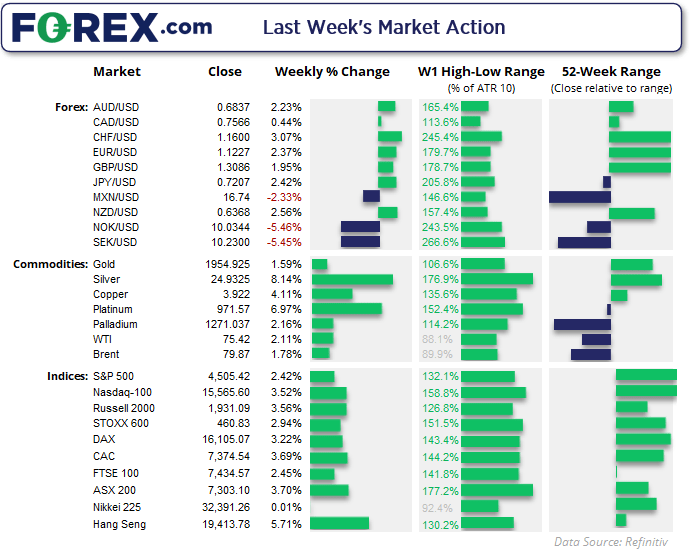
Technically Speaking:
- A stronger US dollar saw AUD/USD pullback from its 4-week high, and early trade is testing Friday’s low to suggest a retest of the May high (68.18) or the 68c handle
- USD/JPY formed a bullish engulfing day to snap a 6-day losing streak. Whilst this brings the potential for a bounce, we may also find that price action is retrained around these lows after such a volatile move (without a fresh catalyst to broadly strengthen the US dollar)
- A bullish engulfing day formed on USD/CAD and its daily range was 192% of its 20-day average
- A weekly bullish pinbar formed on AUD/JPY to suggest a swing low may have formed at 93.27. Friday’s spinning top doji warns of a potential pullback, but we’d consider bullish setups above Wednesday high of 92.21
- USD/CNH fell to a 19-day low last week but Friday’s bid for the US dollar helped the pair print a bullish-closed Dohi at the 50-day EMA, so perhaps a near-term upswing could be on the cards
- A weekly gravestone Doji formed on the Nikkei 225 and its low found support around a 61.8% Fibonacci level and 50-day EMA. Bulls could seek dips above 32k for near-term long opportunities.
- A bullish pinbar week formed on the Hang Seng at the end of May and a higher low has since formed, which suggests momentum is trying to turn higher and break out of a potential bullish continuation pattern
- Whilst the China A50 broke out to a 17-day high on Thursday, Friday’s retracement suggests there is some hesitancy for prices to break above the bearish trendline from the January high. But if prices can hold above the 12,400 lows then the bias is for prices to eventually break higher.
- By Thursday’s high, WTI crude oil has rallied over 15% in just 10 days to close at its highest level since April. Yet Friday’s bearish engulfing / outside bar suggests the rally is about to enter a period of consolidation (at a minimum) or pullback
ASX 200 at a glance:
- The ASX 200 rallied for a fourth consecutive day, formed a bullish engulfing week and closed above 7300
- The high of the day was near the June 22 open price, which is part of a potential gap resistance zone between 7135 – 7335
- Given that the prices are in close proximity to the March and June highs, met resistance at an opening gap range, the daily RSI (2) is within the overbought zone and a weak lead from Wall Street, upside potential could be limited over the near-term
- Furthermore, the weekly direction has alternated over the past six weeks which serves as a reminder of the choppy trading conditions on this timeframes, which suggests opportunities may be best suited to intraday timeframes


Gold Chart:
Gold has enjoyed a rally on the back of disinflationary data for the US (namely the softer CPI and PPI reports). Yet the stronger US dollar saw gold form a relatively small bearish engulfing candle on the daily chart, which suggests prices could be set to retrace against some of its recent gains. The 4-hour chart shows the rally stalled at the June VPOC (volume point of control) and a choppy consolidation has formed. There is also a liquidity gap between 1940 – 1950 which may seek to be filled. In which case, bears could seek the countertrend move towards trend support, or bulls could wait to see if a higher low formed above a support level or wait for a break above the recent consolidation.

-- Written by Matt Simpson
Follow Matt on Twitter @cLeverEdge
How to trade with City Index
You can trade with City Index by following these four easy steps:
- Open an account, or log in if you’re already a customer
• Open an account in the UK
• Open an account in Australia
• Open an account in Singapore
- Search for the market you want to trade in our award-winning platform
- Choose your position and size, and your stop and limit levels
- Place the trade
Related tags:



Open an account in minutes
Experience award-winning platforms with fast and secure execution, and enjoy tight spreads from 0.5 pts on FX and 0.3 pts on indices.
Economic calendar
Web Trader platform
Our sophisticated web-based platform is packed with features.
Related articles
Gold forecast: Rising yields become too hot for gold, but the outlook is far from bearish
Gold and silver prices took a plunge today, with the former down 3% and the latter falling some 5% by mid European session, before bouncing off their lows. The losses come after the metals remained largely supported until last week, despite the big dollar rally and surging bond yields as we have seen in recent weeks. But it simply got too much, and the metals succumbed to pressure today.

AUD/USD forecast: Currency Pair of the Week | September 28, 2026
The week has started with stocks, gold, silver and bitcoin all falling, as crude oil rebounded and bond yields pushed further higher. Trump refusing to agree to Tehran’s proposal to re-open the Strait of Hormuz has left the markets disappointed. Still, reports that mediators are expected to hold talks with the two sides on an amended version of the 7-day proposal that Iran presented, keeps hopes alive that we may see some progress.

Gold Outlook: XAU/USD hit hard as US yields, dollar resume ascent
A stronger dollar, surging front-end yields and renewed geopolitical tension have combined to push gold back towards key technical support.

This report is intended for general circulation only. It should not be construed as a recommendation, or an offer (or solicitation of an offer) to buy or sell any financial products. The information provided does not take into account your specific investment objectives, financial situation or particular needs. Before you act on any recommendation that may be contained in this report, independent advice ought to be sought from a financial adviser regarding the suitability of the investment product, taking into account your specific investment objectives, financial situation or particular needs.
StoneX Financial Pte. Ltd., may distribute reports produced by its respective foreign entities or affiliates within the StoneX group of companies or third parties pursuant to an arrangement under Regulation 32C of the Financial Advisers Regulations. Where the report is distributed to a person in Singapore who is not an accredited investor, expert investor or an institutional investor (as defined in the Securities Futures Act), StoneX Financial Pte. Ltd. accepts legal responsibility to such persons for the contents of the report only to the extent required by law. Singapore recipients should contact StoneX Financial Pte. Ltd. at 6826 9988 for matters arising from, or in connection with the report.
In the case of all other recipients of this report, to the extent permitted by applicable laws and regulations neither StoneX Financial Pte. Ltd. nor its associated companies will be responsible or liable for any loss or damage incurred arising out of, or in connection with, any use of the information contained in this report and all such liability is hereby expressly disclaimed. No representation or warranty is made, express or implied, that the content of this report is complete or accurate.
StoneX Financial Pte. Ltd. is not under any obligation to update this report.
Trading CFDs carries a high level of risk that may not be suitable for some investors. Consider your investment objectives, level of experience, financial resources, risk appetite and other relevant circumstances carefully. The possibility exists that you could lose some or all of your investments, including your initial deposits. If in doubt, please seek independent expert advice. Visit www.forex.com/en-sg/terms-and-policies for the complete Risk Disclosure Statement.