




ASX 200 Index Bullish Breakout of Triangle Pattern
Asia Pacific markets perform positive today. Australia's ASX 200 rose 1.2%.......
Share this:
Asia Pacific markets perform positive today. Australia's ASX 200 rose 1.2%. Meanwhile, Japan's Nikkei 225 was up around 2.7% and Hong Kong's Hang Seng Index climbed around 2%.
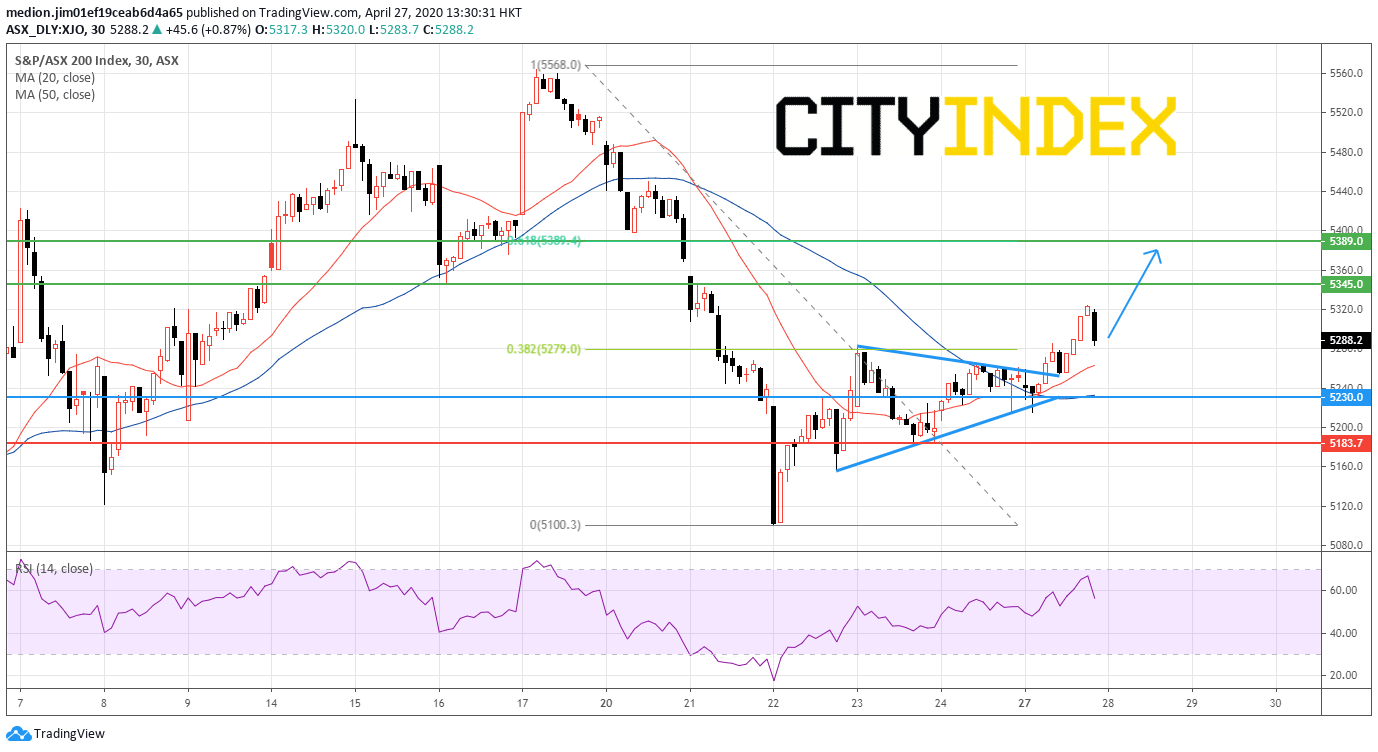
Let's take a look the important equity news for Australia market first. National Bank of Australia (NAB), a major Australian bank, announced the launch of a 3.50 billion Australian dollars capital raising though share sale, saying the action "is expected to increased the Group's Common Equity Tier 1 Capital (CET1) ratio to 11.20%" from 10.39% as of March 31, 2020. Meanwhile, the bank reported that 1H net income declined 51.3% on year to 1.31 billion Australian dollars and net operating income fell 3.4% to 8.57 billion Australian dollars on net interest income of 6.91 billion Australian dollars, up 1.9%. The bank proposed an interim dividend of 0.30 Australian dollar per share, down from 0.83 Australian dollar per share in the prior-year period.For the Australia's ASX 200 Index, there is an interesting pattern to focus on the 30 minute chart. The index has validated a bullish breakout of the symmetric triangle, a bullish continuous pattern to indicate the resumption of recent bullish trend. Besides, the golden cross between 20-period and 50-period moving averages has been identified, indicating a bullish outlook. Currently, the prices also break above 5279 (the previous high and 38.2% retracement level). As long as 5230 acts as the key support level, the index prices could consider a further advance to the resistance level at 5345 and 5389, corresponding to the 61.8% retracement level between April 17 high and April 22 low.
Source: GAIN Capital, TradingView
Asia Pacific markets perform positive today. Australia's ASX 200 rose 1.2%. Meanwhile, Japan's Nikkei 225 was up around 2.7% and Hong Kong's Hang Seng Index climbed around 2%.
Let's take a look the important equity news for Australia market first. National Bank of Australia (NAB), a major Australian bank, announced the launch of a 3.50 billion Australian dollars capital raising though share sale, saying the action "is expected to increased the Group's Common Equity Tier 1 Capital (CET1) ratio to 11.20%" from 10.39% as of March 31, 2020. Meanwhile, the bank reported that 1H net income declined 51.3% on year to 1.31 billion Australian dollars and net operating income fell 3.4% to 8.57 billion Australian dollars on net interest income of 6.91 billion Australian dollars, up 1.9%. The bank proposed an interim dividend of 0.30 Australian dollar per share, down from 0.83 Australian dollar per share in the prior-year period.
For the Australia's ASX 200 Index, there is an interesting pattern to focus on the 30 minute chart. The index has validated a bullish breakout of the symmetric triangle, a bullish continuous pattern to indicate the resumption of recent bullish trend. Besides, the golden cross between 20-period and 50-period moving averages has been identified, indicating a bullish outlook. Currently, the prices also break above 5279 (the previous high and 38.2% retracement level). As long as 5230 acts as the key support level, the index prices could consider a further advance to the resistance level at 5345 and 5389, corresponding to the 61.8% retracement level between April 17 high and April 22 low.
Source: GAIN Capital, TradingView
Latest market news




Open an account in minutes
Experience award-winning platforms with fast and secure execution, and enjoy tight spreads from 0.5 pts on FX and 0.3 pts on indices.
Economic calendar
Web Trader platform
Our sophisticated web-based platform is packed with features.
Related articles

ASX 200 Rebound Stalls Despite Wall Street Surge
The ASX 200 rebound is struggling for traction despite a powerful Wall Street rally, leaving 8800 resistance and downside risks in focus.


Nikkei threatens breakout as tech rebound broadens
Breakouts across the SOX and Nasdaq are being matched by rebounds across Asia, with the Nikkei now threatening to join the move.


Nasdaq 100 Forecast: Confidence Returns as the Index Challenges Record Highs
The trading week is getting underway with renewed bullish momentum across Nasdaq. This is reflected in today's session, where the index has gained more than 2.5%, highlighting a buying bias that has not been observed with this level of strength in several weeks.

This report is intended for general circulation only. It should not be construed as a recommendation, or an offer (or solicitation of an offer) to buy or sell any financial products. The information provided does not take into account your specific investment objectives, financial situation or particular needs. Before you act on any recommendation that may be contained in this report, independent advice ought to be sought from a financial adviser regarding the suitability of the investment product, taking into account your specific investment objectives, financial situation or particular needs.
StoneX Financial Pte. Ltd., may distribute reports produced by its respective foreign entities or affiliates within the StoneX group of companies or third parties pursuant to an arrangement under Regulation 32C of the Financial Advisers Regulations. Where the report is distributed to a person in Singapore who is not an accredited investor, expert investor or an institutional investor (as defined in the Securities Futures Act), StoneX Financial Pte. Ltd. accepts legal responsibility to such persons for the contents of the report only to the extent required by law. Singapore recipients should contact StoneX Financial Pte. Ltd. at 6826 9988 for matters arising from, or in connection with the report.
In the case of all other recipients of this report, to the extent permitted by applicable laws and regulations neither StoneX Financial Pte. Ltd. nor its associated companies will be responsible or liable for any loss or damage incurred arising out of, or in connection with, any use of the information contained in this report and all such liability is hereby expressly disclaimed. No representation or warranty is made, express or implied, that the content of this report is complete or accurate.
StoneX Financial Pte. Ltd. is not under any obligation to update this report.
Trading CFDs carries a high level of risk that may not be suitable for some investors. Consider your investment objectives, level of experience, financial resources, risk appetite and other relevant circumstances carefully. The possibility exists that you could lose some or all of your investments, including your initial deposits. If in doubt, please seek independent expert advice. Visit www.forex.com/en-sg/terms-and-policies for the complete Risk Disclosure Statement.