



BOC Preview: How much will the BOC hike?
Most are expected a hike of 50bps; however, some are hoping that it may hike as much as 75bps!
Share this:

The Bank of Canada meets on Wednesday to decide how much it should raise interest rates. When the central bank last met on March 2nd, it hiked interest rates by 25bps to 0.5%. This was the first time the BOC hiked rates since October 2018. At the time, the BOC also decided to maintain the current size of its balance sheet by reinvesting the proceeds of its government bonds until it deemed appropriate. Since then, Canada released its February CPI data. The print was 5.7% YoY vs 5.5% YoY expected and 5.1% YoY last. In addition, Canada also released its February and March Employment Change. The results were +336,600 and +72,500, respectively. With strong inflation and strong employment data, the BOC is sure to begin tapering its bond holdings. The only question for the central bank is “How much should they hike?”. Most are expected a hike of 50bps; however, some are hoping that it may hike as much as 75bps!
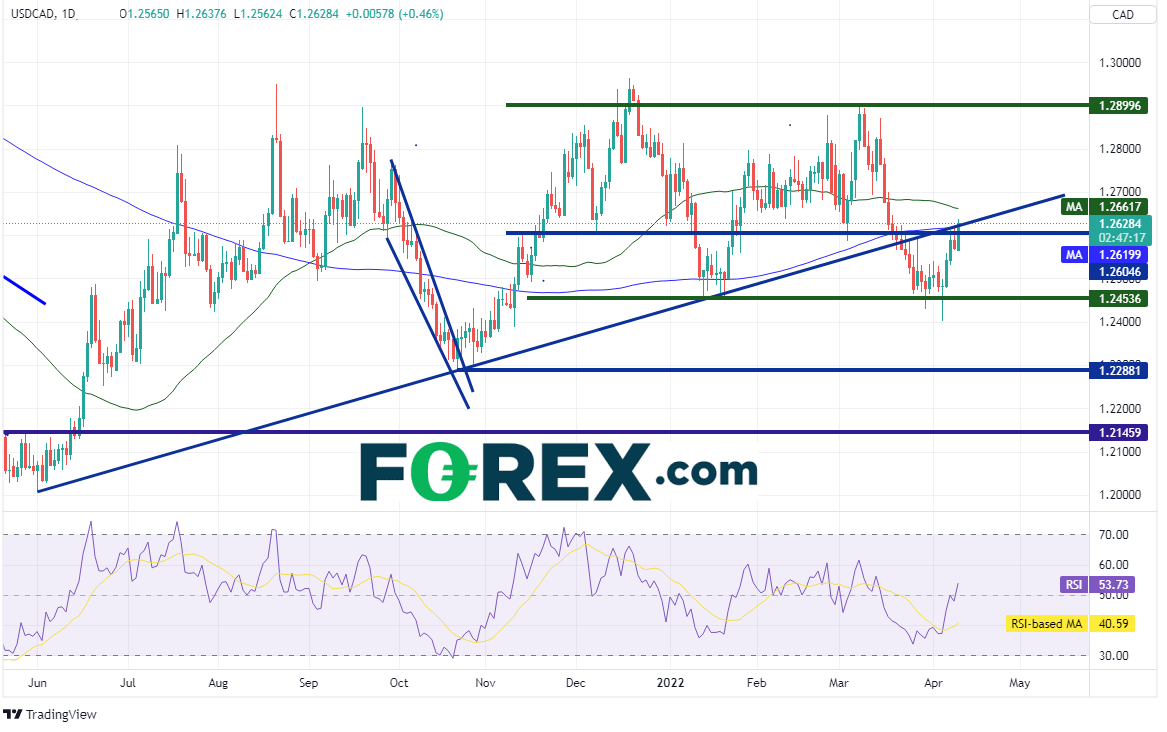
USD/CAD has been trading in a range since November 10th between 1.2454 and 1.2900. However, on April 5th, the pair tested the bottom of the range and failed, leaving a hammer candlestick on the daily timeframe. Hammers are reversal signals. The pair hasn’t looked back since and has formed a bullish engulfing candle today! In addition, USD/CAD traded above horizontal resistance, and upward sloping trendline dating to June 1st, 2021, and the 200 Day Moving Average, near 1.2620.
Source: Tradingview, Stone X
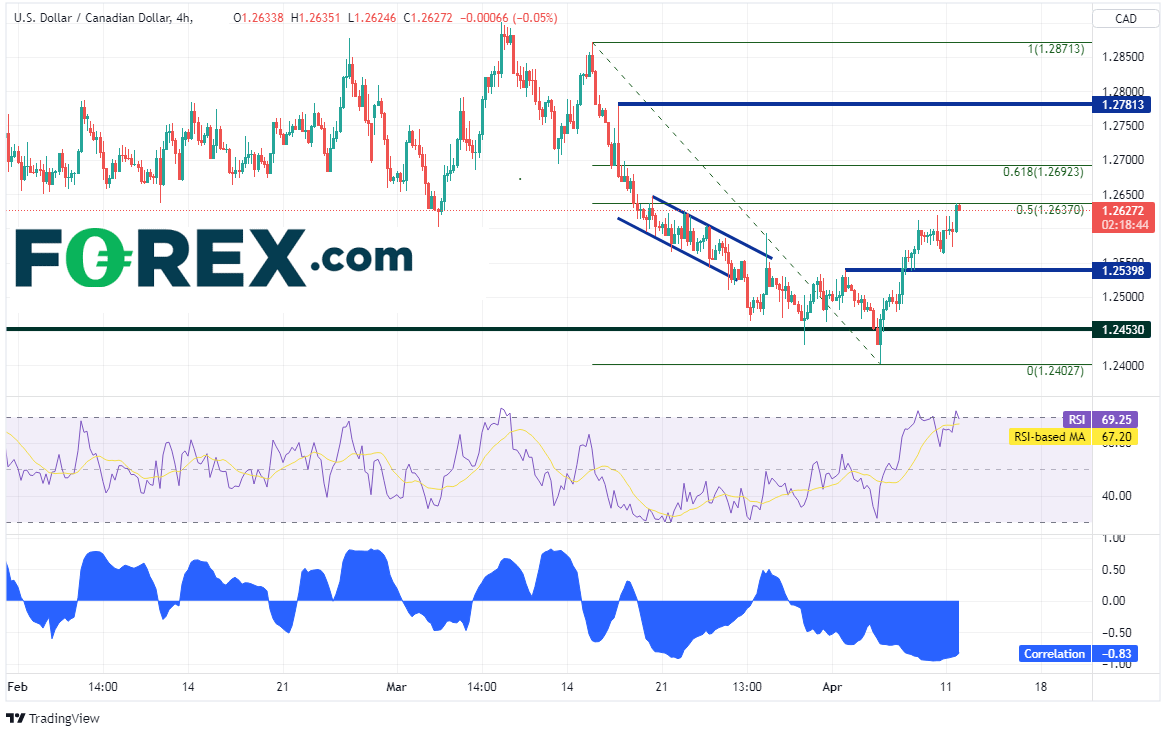
On a 240-minute timeframe, USD/CAD has retraced to the 50% level from the highs of March 15th to the lows of April 5th. First resistance is 50 Day Moving Average at 1.2660 (see daily), then the 61.8% Fibonacci retracement level from the March 15th high to the April 5th lows near 1.2692. Above there, price can trade to horizontal resistance at 1.2781. However, notice the RSI has moved into overbought territory, an indication price may be ready for a pullback. First support below the 200-Day Moving Average is horizontal support at 1.2540. Below there, price can drop to the April 5th lows near 1.2402.
Source: Tradingview, Stone X
Notice as well that USD/CAD and WTI Crude Oil have become highly negatively correlated once again with a correlation coefficient of -0.83. Any reading below -0.80 is considered a strong, negative correlation. (With Crude being so volatile over the last month, the correlation had fallen out of favor). Therefore, if one is looking for direction for USD/CAD, WTI Crude Oil may offer some help.
The Bank of Canada meets on Wednesday and is expected to hike interest rates. In addition, it is expected to begin to unwind its balance sheet. However, the markets will be waiting to see if the BOC hikes by 50bps or by 75bps.
The Bank of Canada meets on Wednesday to decide how much it should raise interest rates. When the central bank last met on March 2nd, it hiked interest rates by 25bps to 0.5%. This was the first time the BOC hiked rates since October 2018. At the time, the BOC also decided to maintain the current size of its balance sheet by reinvesting the proceeds of its government bonds until it deemed appropriate. Since then, Canada released its February CPI data. The print was 5.7% YoY vs 5.5% YoY expected and 5.1% YoY last. In addition, Canada also released its February and March Employment Change. The results were +336,600 and +72,500, respectively. With strong inflation and strong employment data, the BOC is sure to begin tapering its bond holdings. The only question for the central bank is “How much should they hike?”. Most are expected a hike of 50bps; however, some are hoping that it may hike as much as 75bps!
Everything you wanted to know about the Bank of Canada
USD/CAD has been trading in a range since November 10th between 1.2454 and 1.2900. However, on April 5th, the pair tested the bottom of the range and failed, leaving a hammer candlestick on the daily timeframe. Hammers are reversal signals. The pair hasn’t looked back since and has formed a bullish engulfing candle today! In addition, USD/CAD traded above horizontal resistance, and upward sloping trendline dating to June 1st, 2021, and the 200 Day Moving Average, near 1.2620.

Source: Tradingview, Stone X
Trade USD/CAD now: Login or Open a new account!
• Open an account in the UK
• Open an account in Australia
• Open an account in Singapore
On a 240-minute timeframe, USD/CAD has retraced to the 50% level from the highs of March 15th to the lows of April 5th. First resistance is 50 Day Moving Average at 1.2660 (see daily), then the 61.8% Fibonacci retracement level from the March 15th high to the April 5th lows near 1.2692. Above there, price can trade to horizontal resistance at 1.2781. However, notice the RSI has moved into overbought territory, an indication price may be ready for a pullback. First support below the 200-Day Moving Average is horizontal support at 1.2540. Below there, price can drop to the April 5th lows near 1.2402.

Source: Tradingview, Stone X
Notice as well that USD/CAD and WTI Crude Oil have become highly negatively correlated once again with a correlation coefficient of -0.83. Any reading below -0.80 is considered a strong, negative correlation. (With Crude being so volatile over the last month, the correlation had fallen out of favor). Therefore, if one is looking for direction for USD/CAD, WTI Crude Oil may offer some help.
The Bank of Canada meets on Wednesday and is expected to hike interest rates. In addition, it is expected to begin to unwind its balance sheet. However, the markets will be waiting to see if the BOC hikes by 50bps or by 75bps.
Learn more about forex trading opportunities.
Related tags:


Open an account in minutes
Experience award-winning platforms with fast and secure execution, and enjoy tight spreads from 0.5 pts on FX and 0.3 pts on indices.
Economic calendar
Web Trader platform
Our sophisticated web-based platform is packed with features.
Related articles
Gold forecast: Rising yields become too hot for gold, but the outlook is far from bearish
Gold and silver prices took a plunge today, with the former down 3% and the latter falling some 5% by mid European session, before bouncing off their lows. The losses come after the metals remained largely supported until last week, despite the big dollar rally and surging bond yields as we have seen in recent weeks. But it simply got too much, and the metals succumbed to pressure today.

USD into a Massive Week as Yields Fly and Gold Breaks
It’s a huge week with PCE and NFP, but it’s what’s happening off of the calendar that demands attention with US yields flying to fresh multi-decade highs.


USDJPY Forecast Intervention Fears Clash with Dollar Strength
Recent trading sessions have produced mixed results for the Japanese yen. By the end of last week, USD/JPY had fallen by more than 1.00%, reflecting a modest recovery in the yen. However, the start of this week has seen the pair move slightly back in favor of the U.S. dollar, posting gains of around 0.04%.

This report is intended for general circulation only. It should not be construed as a recommendation, or an offer (or solicitation of an offer) to buy or sell any financial products. The information provided does not take into account your specific investment objectives, financial situation or particular needs. Before you act on any recommendation that may be contained in this report, independent advice ought to be sought from a financial adviser regarding the suitability of the investment product, taking into account your specific investment objectives, financial situation or particular needs.
StoneX Financial Pte. Ltd., may distribute reports produced by its respective foreign entities or affiliates within the StoneX group of companies or third parties pursuant to an arrangement under Regulation 32C of the Financial Advisers Regulations. Where the report is distributed to a person in Singapore who is not an accredited investor, expert investor or an institutional investor (as defined in the Securities Futures Act), StoneX Financial Pte. Ltd. accepts legal responsibility to such persons for the contents of the report only to the extent required by law. Singapore recipients should contact StoneX Financial Pte. Ltd. at 6826 9988 for matters arising from, or in connection with the report.
In the case of all other recipients of this report, to the extent permitted by applicable laws and regulations neither StoneX Financial Pte. Ltd. nor its associated companies will be responsible or liable for any loss or damage incurred arising out of, or in connection with, any use of the information contained in this report and all such liability is hereby expressly disclaimed. No representation or warranty is made, express or implied, that the content of this report is complete or accurate.
StoneX Financial Pte. Ltd. is not under any obligation to update this report.
Trading CFDs carries a high level of risk that may not be suitable for some investors. Consider your investment objectives, level of experience, financial resources, risk appetite and other relevant circumstances carefully. The possibility exists that you could lose some or all of your investments, including your initial deposits. If in doubt, please seek independent expert advice. Visit www.forex.com/en-sg/terms-and-policies for the complete Risk Disclosure Statement.