



Burberry 4Q sales better than expected
Burberry, the luxury fashion house, posted 4Q retail like-for-like sales down 27%, slighter better than the 30% drop expected by the Company, showing encouraging signs.
Share this:

Burberry, the luxury fashion house, posted 4Q retail like-for-like sales down 27%, slighter better than the 30% drop expected by the Company, showing encouraging signs.
The company said: “we are not in a position to provide specific guidance for FY 2021 at this stage as it is currently challenging to predict the course of the pandemic and the longer lasting economic consequences. However, we currently have 50% of our store network closed and we expect our first quarter (to end June 2020) to be severely impacted with store closures likely to be at or near peak for most of the quarter."
The company said: “we are not in a position to provide specific guidance for FY 2021 at this stage as it is currently challenging to predict the course of the pandemic and the longer lasting economic consequences. However, we currently have 50% of our store network closed and we expect our first quarter (to end June 2020) to be severely impacted with store closures likely to be at or near peak for most of the quarter."
Given current uncertainty, final dividend has not been declared.
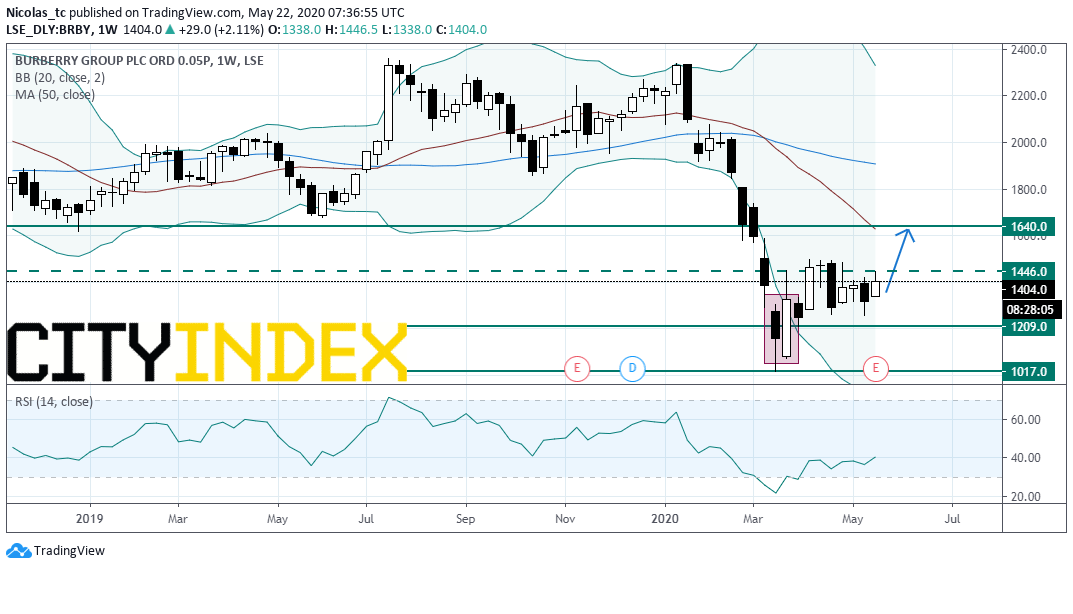
From a chartist’s point of view, the bullish engulfing pattern formed in March on a weekly chart is a sign of hope. Prices need to stand above 1209p to maintain the bullish bias.
A break above 1446p would deliver a bullish signal (buy stop) and would call for a short term rebound towards the 20WMA and horizontal resistance at 1640p.
Alternatively, a push below 1209p would reinstate a bearish bias and would open a path to further decline towards 1017p.
Source: GAIN Capital, TradingView
Burberry, the luxury fashion house, posted 4Q retail like-for-like sales down 27%, slighter better than the 30% drop expected by the Company, showing encouraging signs.
The company said: “we are not in a position to provide specific guidance for FY 2021 at this stage as it is currently challenging to predict the course of the pandemic and the longer lasting economic consequences. However, we currently have 50% of our store network closed and we expect our first quarter (to end June 2020) to be severely impacted with store closures likely to be at or near peak for most of the quarter."
Given current uncertainty, final dividend has not been declared.
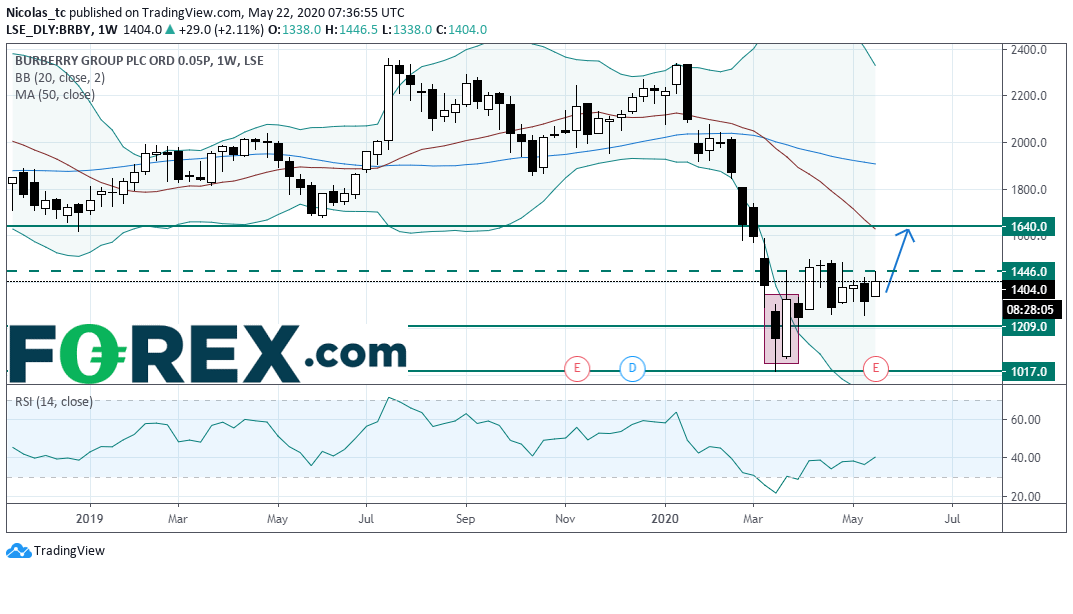
From a chartist’s point of view, the bullish engulfing pattern formed in March on a weekly chart is a sign of hope. Prices need to stand above 1209p to maintain the bullish bias.
A break above 1446p would deliver a bullish signal (buy stop) and would call for a short term rebound towards the 20WMA and horizontal resistance at 1640p.
Alternatively, a push below 1209p would reinstate a bearish bias and would open a path to further decline towards 1017p.
Source: GAIN Capital, TradingView
Related tags:



Open an account in minutes
Experience award-winning platforms with fast and secure execution, and enjoy tight spreads from 0.5 pts on FX and 0.3 pts on indices.
Economic calendar
Web Trader platform
Our sophisticated web-based platform is packed with features.
Related articles

Euro Short-term Outlook: EUR/USD Selloff Nears Critical Yearly Support 9 23 2026
Euro has fallen seven of the past nine sessions, with stretched momentum raising the stakes as EUR/USD closes in on a major inflection zone.


Australian Dollar Technical Outlook: AUD/USD Breakdown Threatens Deeper Correction 9 23 2026
AUD/USD remains under pressure after breaking key trend support, with the latest decline putting the focus on the next major downside pivot.

EUR/USD, Nasdaq Price Outlook: Reversal Risks Build
EUR/USD and Nasdaq Price Outlook: Overbought/oversold momentum on hourly and daily time frames is raising reversal risks across the U.S. dollar, EUR/USD and Nasdaq after a strong weekly advance.

This report is intended for general circulation only. It should not be construed as a recommendation, or an offer (or solicitation of an offer) to buy or sell any financial products. The information provided does not take into account your specific investment objectives, financial situation or particular needs. Before you act on any recommendation that may be contained in this report, independent advice ought to be sought from a financial adviser regarding the suitability of the investment product, taking into account your specific investment objectives, financial situation or particular needs.
StoneX Financial Pte. Ltd., may distribute reports produced by its respective foreign entities or affiliates within the StoneX group of companies or third parties pursuant to an arrangement under Regulation 32C of the Financial Advisers Regulations. Where the report is distributed to a person in Singapore who is not an accredited investor, expert investor or an institutional investor (as defined in the Securities Futures Act), StoneX Financial Pte. Ltd. accepts legal responsibility to such persons for the contents of the report only to the extent required by law. Singapore recipients should contact StoneX Financial Pte. Ltd. at 6826 9988 for matters arising from, or in connection with the report.
In the case of all other recipients of this report, to the extent permitted by applicable laws and regulations neither StoneX Financial Pte. Ltd. nor its associated companies will be responsible or liable for any loss or damage incurred arising out of, or in connection with, any use of the information contained in this report and all such liability is hereby expressly disclaimed. No representation or warranty is made, express or implied, that the content of this report is complete or accurate.
StoneX Financial Pte. Ltd. is not under any obligation to update this report.
Trading CFDs carries a high level of risk that may not be suitable for some investors. Consider your investment objectives, level of experience, financial resources, risk appetite and other relevant circumstances carefully. The possibility exists that you could lose some or all of your investments, including your initial deposits. If in doubt, please seek independent expert advice. Visit www.forex.com/en-sg/terms-and-policies for the complete Risk Disclosure Statement.