





Crude Oil Forecast: WTI Pulls Back from $65 as OPEC+ Meeting Approaches
Despite the rebound seen in WTI at the beginning of the week, when prices traded above $65 per barrel, today’s session has brought a downward correction, with the price losing more than 1.5% in the short term.
Share this:

Despite the rebound seen in WTI at the beginning of the week, when prices traded above $65 per barrel, today’s session has brought a downward correction, with the price losing more than 1.5% in the short term. Selling pressure has re-emerged as the market awaits new comments from OPEC+, which could confirm that crude oil production will continue to increase in the coming months. If this outlook is reinforced, selling pressure could intensify in the sessions ahead.
What to Expect from OPEC+?
OPEC+ is scheduled to meet on Sunday, and the market expects the group of oil-producing countries to confirm another increase in global crude production, extending the trend seen since April of this year. During that period, output has already risen by about 2.5 million barrels per day, representing roughly 2.4% of global demand. For this meeting, an increase similar to the August announcement of 547,000 barrels per day is anticipated, though the possibility remains of reversing voluntary cuts, which currently total 1.6 million barrels per day.
OPEC+ still has room to deliver significant increases in the short term, as it looks to phase out voluntary cuts introduced in previous years. This policy is largely a response to the pressure from the United States, which has drastically boosted its own production, driving crude prices lower throughout the year. The oil cartel appears unwilling to fall behind in this context of expanding supply.
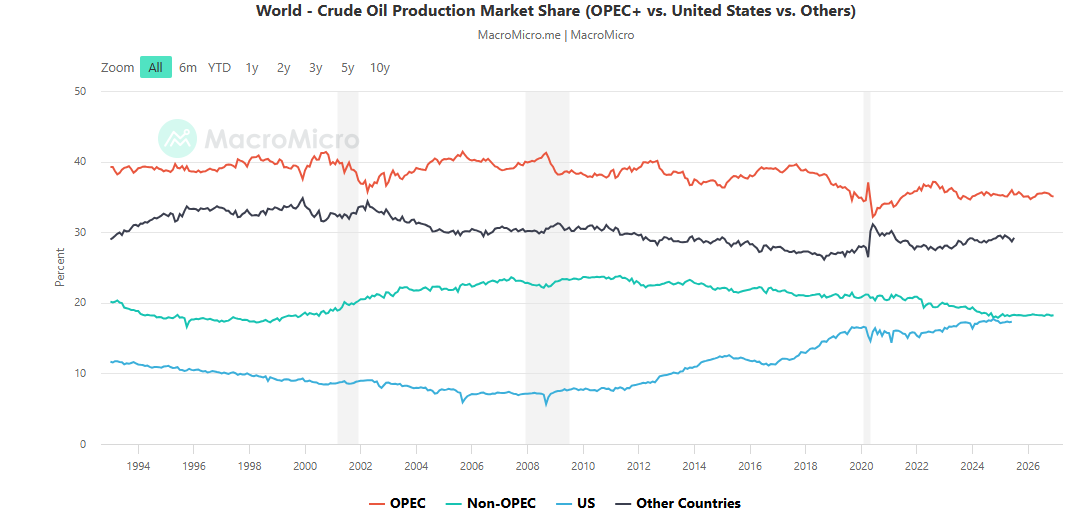
It is important to note that OPEC, without its allies, continues to be the dominant global oil producer, accounting for around 35% of global production, while the U.S., despite its steady growth, holds about 17%. This underscores OPEC’s decisive influence over oil markets and highlights how its production decisions can have a strong impact on price behavior.
Source: MacroMicro
As a result, if OPEC maintains its policy of constant production increases into the remaining months of 2025, the market could face a potential oversupply, creating stronger selling pressure on WTI in the short term. Confirmation of this outlook in Sunday’s meeting could solidify a more significant bearish wave in the sessions ahead.
Is Market Confidence Falling?
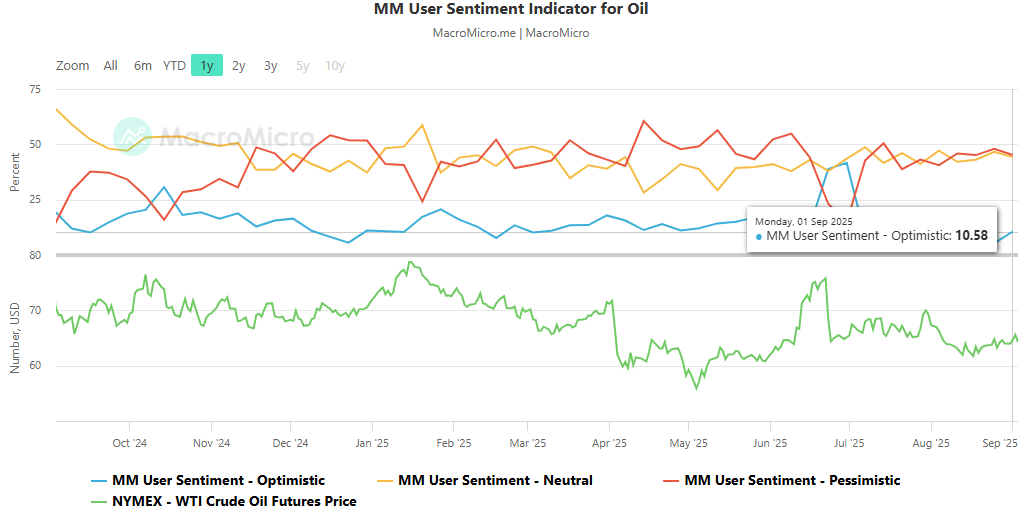
The prospect of rising production is also weighing on market sentiment. According to the MM User Sentiment Indicator for Oil, only 10.58% of investors are optimistic about crude prices over the next three months, while 45.19% are pessimistic and 44.23% remain neutral.
Source: MacroMicro
This weakening of sentiment reflects how expectations of greater supply are undermining confidence. Unless optimism picks up again, demand for WTI could remain weak, fueling additional downward pressure in the short term.
WTI Technical Outlook
Source: StoneX, Tradingview
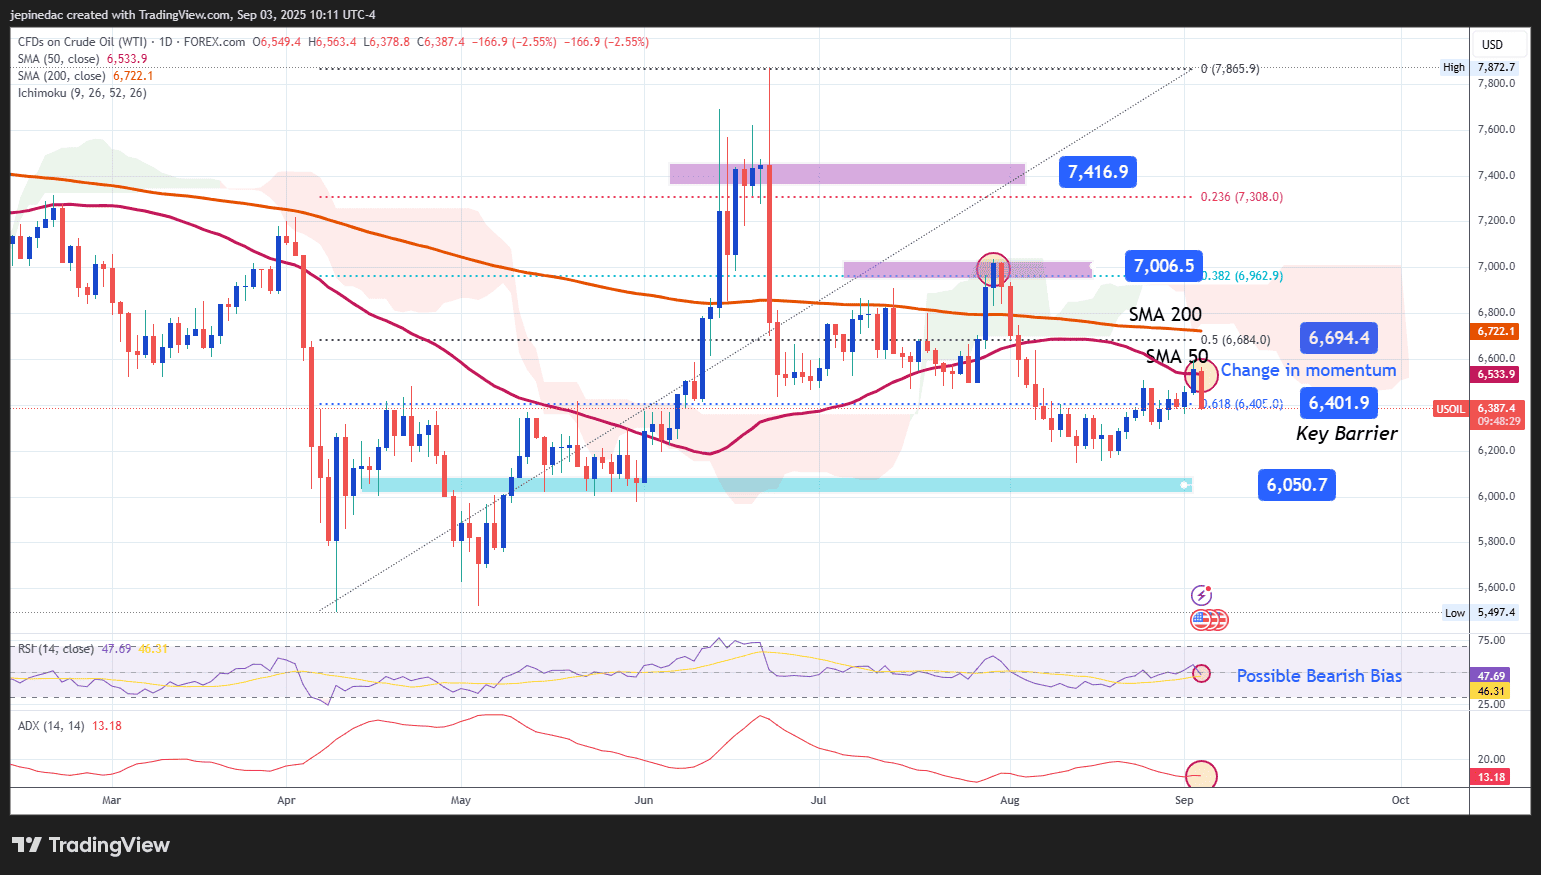
- Significant Bearish Move: Although oil had attempted to consolidate a short-term bullish trend in recent weeks, today’s movements show a notable bearish impulse, breaking the bullish bias that had been building in prior sessions. If current selling pressure persists, a new bearish bias could become dominant in the short term.
- RSI: currently shows a negative slope and is approaching the neutral 50 level once again. If this level is broken, a dominant selling impulse could emerge, increasing downward pressure in the average of the last 14 sessions.
- ADX: remains below 20, indicating that volatility in recent price swings is still limited. As long as this persists, the market is likely to retain a neutral bias in the short term.
Key Levels:
- $67 – Relevant Resistance: corresponds to the zone of the 200-period moving average and is the most important level to watch for validating a bullish scenario. A breakout above this level would confirm the emergence of a short-term uptrend.
- $64 – Current Barrier: aligned with the 61.8% Fibonacci retracement, serving as the key reference for the bearish bias. Remaining below this zone could reinforce selling pressure in the sessions ahead.
- $60 – Key Support: the most important psychological level in the short term. A drop toward this area could mark the beginning of a more consistent bearish trend in the WTI chart.
Written by Julian Pineda, CFA – Market Analyst
Follow him at: @julianpineda25
Related tags:
Latest market news




Open an account in minutes
Experience award-winning platforms with fast and secure execution, and enjoy tight spreads from 0.5 pts on FX and 0.3 pts on indices.
Economic calendar
Web Trader platform
Our sophisticated web-based platform is packed with features.
Related articles
EUR/USD, USD/JPY Outlook: Oil, yields and an FX identity crisis
Crude oil is setting the tone across rates and FX, leaving EUR/USD vulnerable and USD/JPY caught between higher Treasury yields and the growing threat of intervention

Nasdaq 100 Forecast: NDX falls as oil jumps and Treasury yields rise
U.S. stocks are pointing to a weaker open on Monday after President Trump rejected an Iranian ceasefire, sending oil prices higher and fuelling inflationary concerns and pushing Treasury yields higher.


Crude Oil Q4 2026 Outlook: Will a New Energy-Security Regime Emerge?
Crude Oil Q4 2026 Outlook: The U.S.-Iran conflict has done more than disrupt oil flows. It has challenged many of the assumptions underpinning the global energy security system established after the 1973 oil embargo.

This report is intended for general circulation only. It should not be construed as a recommendation, or an offer (or solicitation of an offer) to buy or sell any financial products. The information provided does not take into account your specific investment objectives, financial situation or particular needs. Before you act on any recommendation that may be contained in this report, independent advice ought to be sought from a financial adviser regarding the suitability of the investment product, taking into account your specific investment objectives, financial situation or particular needs.
StoneX Financial Pte. Ltd., may distribute reports produced by its respective foreign entities or affiliates within the StoneX group of companies or third parties pursuant to an arrangement under Regulation 32C of the Financial Advisers Regulations. Where the report is distributed to a person in Singapore who is not an accredited investor, expert investor or an institutional investor (as defined in the Securities Futures Act), StoneX Financial Pte. Ltd. accepts legal responsibility to such persons for the contents of the report only to the extent required by law. Singapore recipients should contact StoneX Financial Pte. Ltd. at 6826 9988 for matters arising from, or in connection with the report.
In the case of all other recipients of this report, to the extent permitted by applicable laws and regulations neither StoneX Financial Pte. Ltd. nor its associated companies will be responsible or liable for any loss or damage incurred arising out of, or in connection with, any use of the information contained in this report and all such liability is hereby expressly disclaimed. No representation or warranty is made, express or implied, that the content of this report is complete or accurate.
StoneX Financial Pte. Ltd. is not under any obligation to update this report.
Trading CFDs carries a high level of risk that may not be suitable for some investors. Consider your investment objectives, level of experience, financial resources, risk appetite and other relevant circumstances carefully. The possibility exists that you could lose some or all of your investments, including your initial deposits. If in doubt, please seek independent expert advice. Visit www.forex.com/en-sg/terms-and-policies for the complete Risk Disclosure Statement.