



EU CPI comes in much higher than expected
CPI out of the Eurozone was high and the Russia/Ukraine conflict should only make it increase due to soaring energy costs.
Share this:

The main driver of currencies this week has been the Russian invasion into Ukraine. However, traders can’t overlook the most important piece of economic data when it comes to interest rates: inflation. After the stronger than expected harmonized readings for February CPI from Germany, Italy, Spain, and France, it’s not surprising that the headline print for the Eurozone Flash CPI was stronger than expected. The reading was 5.8% YoY vs 5.4% YoY expected and 5.1% YoY in January! This was a record high for Euro Zone CPI. Core CPI, which excludes energy, food, alcohol and tobacco, was up 2.7% YoY vs 2.5% YoY expected and 2.3% YoY in January.
It should be noted that the ECB targets 2% inflation and that February’s increase was before energy prices began to skyrocket because of the Russia/Ukraine conflict. Will continued high CPI cause the ECB to move up it’s timeline for decreasing asset purchases, or even allow the markets to look for a rate hike sooner than the end of year?
ECB’s de Guindos said earlier today that the invasion of Ukraine by Russia will not only have an impact on the economy in the Eurozone, but it will also have an impact on inflation. Therefore, it would seem, that de Guindos is expecting inflation to continue to rise. The next ECB interest rated decision meeting is next week
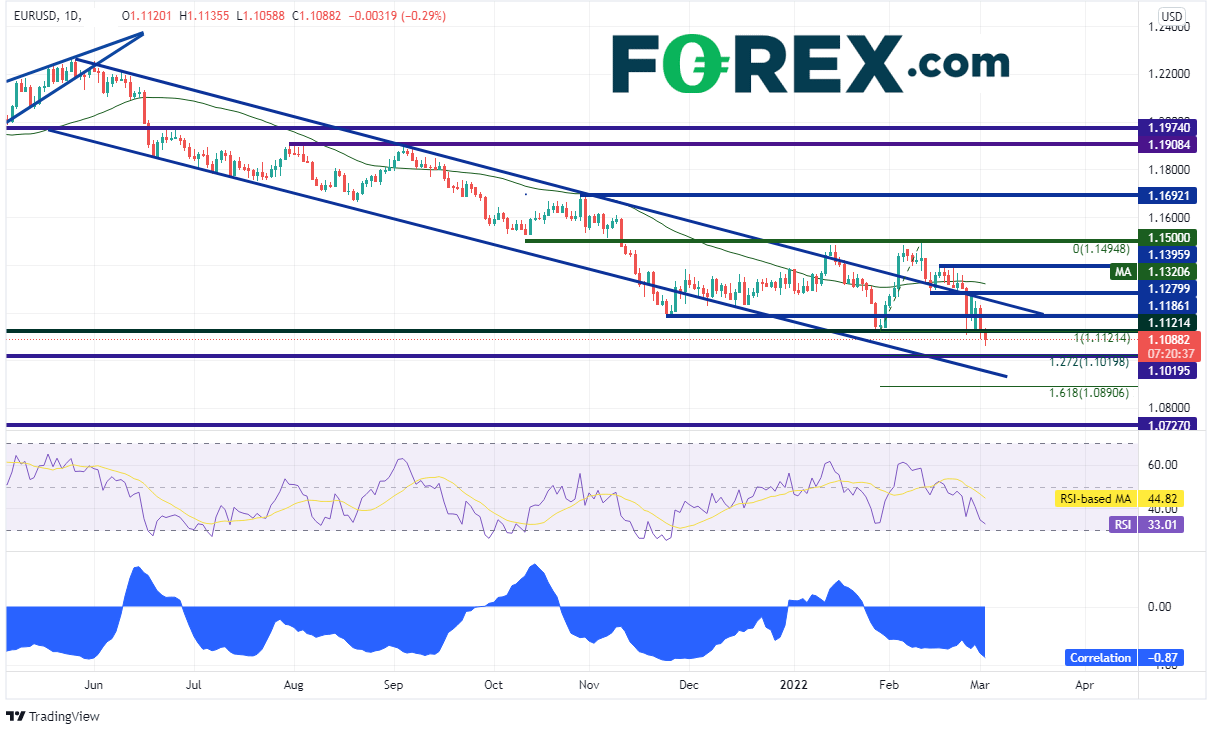
EUR/USD has been moving lower in a downward sloping channel since May 2021. Today, the pair reached its lowest level since May 2020, near 1.1059. Notice that the correlation coefficient between the EUR/USD and USD/RUB is -0.87. A correlation coefficient of -1.00 means that there is a perfectly negative correlation between the 2 assets and that they move In opposite directions 100% of the time. A reading below -0.80 is considered a strong negative correlation. Therefore, if USD/RUB continues to move higher, one can expect EUR/USD to continue to move lower.
Source: Tradingview, Stone X
On a 240- minute timeframe, price has moved convincingly below the January 28th lows and is threatening the 127.2% Fibonacci extension from those lows to the highs from February 10th, near 1.1020. Horizontal support from April 2020 also sits that that level. Below there is the bottom trendline of the long-term channel near 1.0950, then the 161.8% Fibonacci retracement from the recently mentioned timeframe near 1.0890.

Source: Tradingview, Stone X
However, EUR/USD is trading in a descending wedge. Expectations are that price will break out to the upside of the wedge. The target is a 100% retracement of the wedge. In addition, the RSI is diverging with price, an indication that EUR/USD may move higher. Resistance is at the previous support level of 1.1121, then the top trendline of the long-term channel (near the highs of the wedge) near 1.1250. Horizontal resistance sits just above there at 1.1280.
CPI out of the Eurozone was high and the Russia/Ukraine conflict should only make it increase due to soaring energy costs. Traders need to consider whether this will be enough for the ECB to make changes to their asset purchase plan when then meet next week.
The main driver of currencies this week has been the Russian invasion into Ukraine. However, traders can’t overlook the most important piece of economic data when it comes to interest rates: inflation. After the stronger than expected harmonized readings for February CPI from Germany, Italy, Spain, and France, it’s not surprising that the headline print for the Eurozone Flash CPI was stronger than expected. The reading was 5.8% YoY vs 5.4% YoY expected and 5.1% YoY in January! This was a record high for Euro Zone CPI. Core CPI, which excludes energy, food, alcohol and tobacco, was up 2.7% YoY vs 2.5% YoY expected and 2.3% YoY in January.
It should be noted that the ECB targets 2% inflation and that February’s increase was before energy prices began to skyrocket because of the Russia/Ukraine conflict. Will continued high CPI cause the ECB to move up it’s timeline for decreasing asset purchases, or even allow the markets to look for a rate hike sooner than the end of year?
ECB’s de Guindos said earlier today that the invasion of Ukraine by Russia will not only have an impact on the economy in the Eurozone, but it will also have an impact on inflation. Therefore, it would seem, that de Guindos is expecting inflation to continue to rise. The next ECB interest rated decision meeting is next week.
Trade EUR/USD now: Login or Open a new account!
• Open an account in the UK
• Open an account in Australia
• Open an account in Singapore
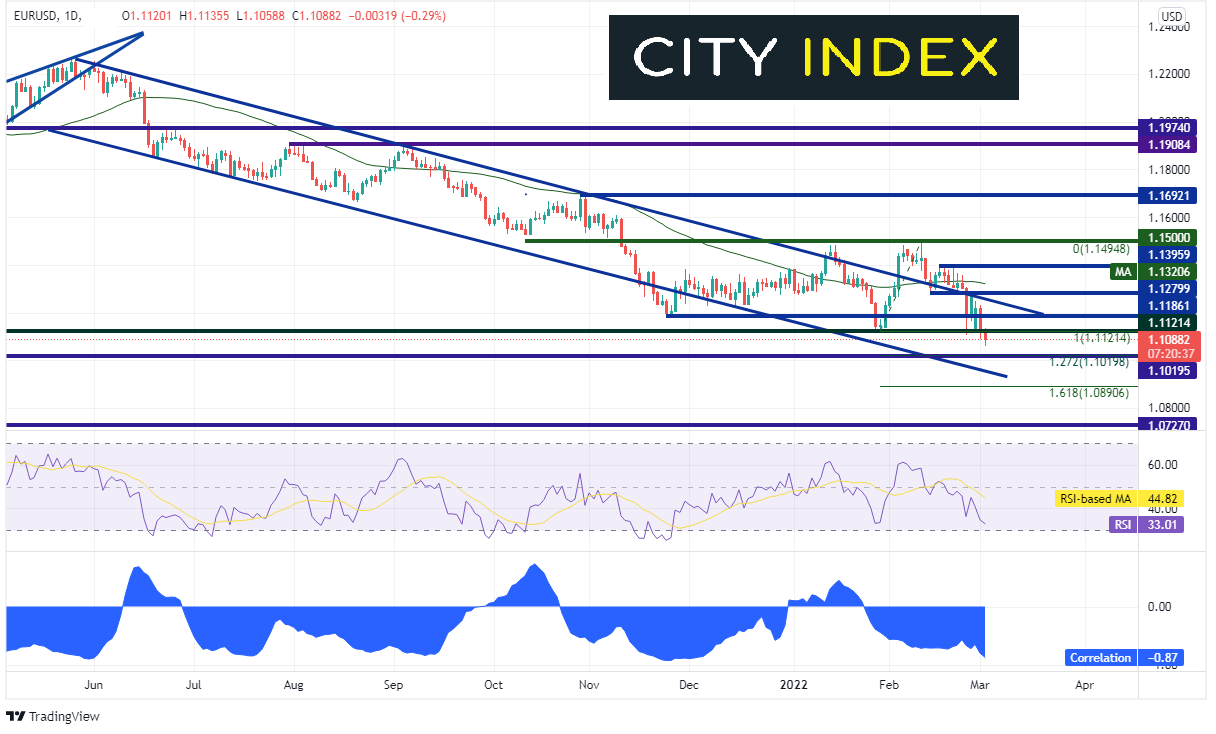
EUR/USD has been moving lower in a downward sloping channel since May 2021. Today, the pair reached its lowest level since May 2020, near 1.1059. Notice that the correlation coefficient between the EUR/USD and USD/RUB is -0.87. A correlation coefficient of -1.00 means that there is a perfectly negative correlation between the 2 assets and that they move In opposite directions 100% of the time. A reading below -0.80 is considered a strong negative correlation. Therefore, if USD/RUB continues to move higher, one can expect EUR/USD to continue to move lower.
Source: Tradingview, Stone X
On a 240- minute timeframe, price has moved convincingly below the January 28th lows and is threatening the 127.2% Fibonacci extension from those lows to the highs from February 10th, near 1.1020. Horizontal support from April 2020 also sits that that level. Below there is the bottom trendline of the long-term channel near 1.0950, then the 161.8% Fibonacci retracement from the recently mentioned timeframe near 1.0890.

Source: Tradingview, Stone X
However, EUR/USD is trading in a descending wedge. Expectations are that price will break out to the upside of the wedge. The target is a 100% retracement of the wedge. In addition, the RSI is diverging with price, an indication that EUR/USD may move higher. Resistance is at the previous support level of 1.1121, then the top trendline of the long-term channel (near the highs of the wedge) near 1.1250. Horizontal resistance sits just above there at 1.1280.
CPI out of the Eurozone was high and the Russia/Ukraine conflict should only make it increase due to soaring energy costs. Traders need to consider whether this will be enough for the ECB to make changes to their asset purchase plan when then meet next week.
Learn more about forex trading opportunities.
Related tags:


Open an account in minutes
Experience award-winning platforms with fast and secure execution, and enjoy tight spreads from 0.5 pts on FX and 0.3 pts on indices.
Economic calendar
Web Trader platform
Our sophisticated web-based platform is packed with features.
Related articles
Gold forecast: Rising yields become too hot for gold, but the outlook is far from bearish
Gold and silver prices took a plunge today, with the former down 3% and the latter falling some 5% by mid European session, before bouncing off their lows. The losses come after the metals remained largely supported until last week, despite the big dollar rally and surging bond yields as we have seen in recent weeks. But it simply got too much, and the metals succumbed to pressure today.

USD into a Massive Week as Yields Fly and Gold Breaks
It’s a huge week with PCE and NFP, but it’s what’s happening off of the calendar that demands attention with US yields flying to fresh multi-decade highs.


USDJPY Forecast Intervention Fears Clash with Dollar Strength
Recent trading sessions have produced mixed results for the Japanese yen. By the end of last week, USD/JPY had fallen by more than 1.00%, reflecting a modest recovery in the yen. However, the start of this week has seen the pair move slightly back in favor of the U.S. dollar, posting gains of around 0.04%.

This report is intended for general circulation only. It should not be construed as a recommendation, or an offer (or solicitation of an offer) to buy or sell any financial products. The information provided does not take into account your specific investment objectives, financial situation or particular needs. Before you act on any recommendation that may be contained in this report, independent advice ought to be sought from a financial adviser regarding the suitability of the investment product, taking into account your specific investment objectives, financial situation or particular needs.
StoneX Financial Pte. Ltd., may distribute reports produced by its respective foreign entities or affiliates within the StoneX group of companies or third parties pursuant to an arrangement under Regulation 32C of the Financial Advisers Regulations. Where the report is distributed to a person in Singapore who is not an accredited investor, expert investor or an institutional investor (as defined in the Securities Futures Act), StoneX Financial Pte. Ltd. accepts legal responsibility to such persons for the contents of the report only to the extent required by law. Singapore recipients should contact StoneX Financial Pte. Ltd. at 6826 9988 for matters arising from, or in connection with the report.
In the case of all other recipients of this report, to the extent permitted by applicable laws and regulations neither StoneX Financial Pte. Ltd. nor its associated companies will be responsible or liable for any loss or damage incurred arising out of, or in connection with, any use of the information contained in this report and all such liability is hereby expressly disclaimed. No representation or warranty is made, express or implied, that the content of this report is complete or accurate.
StoneX Financial Pte. Ltd. is not under any obligation to update this report.
Trading CFDs carries a high level of risk that may not be suitable for some investors. Consider your investment objectives, level of experience, financial resources, risk appetite and other relevant circumstances carefully. The possibility exists that you could lose some or all of your investments, including your initial deposits. If in doubt, please seek independent expert advice. Visit www.forex.com/en-sg/terms-and-policies for the complete Risk Disclosure Statement.