



eurgbp poised for potential pattern breakout 1301462015
<p>After reaching the top of a large pennant pattern late last week, EUR/GBP has since maintained its height near the top of the pattern, and […]</p>
Share this:

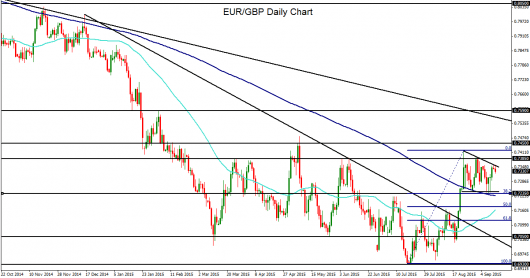
After reaching the top of a large pennant pattern late last week, EUR/GBP has since maintained its height near the top of the pattern, and could be poised for an impending breakout to the upside. Pennant chart formations are price consolidations that are most often considered trend continuation patterns because they frequently serve to extend the trend that immediately preceded the pattern. In the current case, that preceding trend was sharply to the upside.
After hitting a multi-year low of 0.6935 in July, EUR/GBP has been on a choppy path of recovery as the euro has shown some solid gains while the pound has displayed mostly stagnation and decline during the past two months.
The currency pair showed the greatest gains recently in mid-to-late August, when the euro briefly surged above 1.1700 against the US dollar. During that five-day period, the EUR/GBP managed to break out above a key downtrend line extending back to last December, both the 50-day and 200-day moving averages, and the 0.7235 resistance area, ultimately reaching more than a three-month high of 0.7420 in late August.
After the pair rose and then pulled back to form the current pennant pattern, both that 0.7235 level and the 200-day moving average have been running alongside the approximate bottom of the pennant, providing additional support for the pattern. Also providing support for the pattern is the 38.2% Fibonacci retracement level of the bullish run from the noted July low of 0.6935 up to the noted August high of 0.7420.
With the 50-day moving average having risen steadily and pointed to the upside for nearly a month, the technical bias has tentatively switched to the upside recently, as the currency pair had previously been significantly oversold.
In the event of any breakout above the current pennant pattern, the next major resistance target immediately to the upside is at the 0.7450 level. Further to the upside, 0.7600 is the next key resistance objective on any sustained breakout above 0.7450. Strong downside support continues to hold at the noted 0.7235 level, the approximate lower border of the pennant pattern.
Related tags:




Open an account in minutes
Experience award-winning platforms with fast and secure execution, and enjoy tight spreads from 0.5 pts on FX and 0.3 pts on indices.
Economic calendar
Web Trader platform
Our sophisticated web-based platform is packed with features.
Related articles
This report is intended for general circulation only. It should not be construed as a recommendation, or an offer (or solicitation of an offer) to buy or sell any financial products. The information provided does not take into account your specific investment objectives, financial situation or particular needs. Before you act on any recommendation that may be contained in this report, independent advice ought to be sought from a financial adviser regarding the suitability of the investment product, taking into account your specific investment objectives, financial situation or particular needs.
StoneX Financial Pte. Ltd., may distribute reports produced by its respective foreign entities or affiliates within the StoneX group of companies or third parties pursuant to an arrangement under Regulation 32C of the Financial Advisers Regulations. Where the report is distributed to a person in Singapore who is not an accredited investor, expert investor or an institutional investor (as defined in the Securities Futures Act), StoneX Financial Pte. Ltd. accepts legal responsibility to such persons for the contents of the report only to the extent required by law. Singapore recipients should contact StoneX Financial Pte. Ltd. at 6826 9988 for matters arising from, or in connection with the report.
In the case of all other recipients of this report, to the extent permitted by applicable laws and regulations neither StoneX Financial Pte. Ltd. nor its associated companies will be responsible or liable for any loss or damage incurred arising out of, or in connection with, any use of the information contained in this report and all such liability is hereby expressly disclaimed. No representation or warranty is made, express or implied, that the content of this report is complete or accurate.
StoneX Financial Pte. Ltd. is not under any obligation to update this report.
Trading CFDs carries a high level of risk that may not be suitable for some investors. Consider your investment objectives, level of experience, financial resources, risk appetite and other relevant circumstances carefully. The possibility exists that you could lose some or all of your investments, including your initial deposits. If in doubt, please seek independent expert advice. Visit www.forex.com/en-sg/terms-and-policies for the complete Risk Disclosure Statement.