





Euro Technical Forecast: EUR/USD Revisits 1.0500
EUR/USD sellers have had an open door to drive towards parity in 2025 but they’ve continually failed to take advantage, begging the question as to whether bullish reversals may soon show.
Share this:

Euro, EUR/USD Talking Points:
- EUR/USD battled the 1.0500 psychological level as the pair opened on Monday with resistance at the level and then found resistance there again on Thursday.
- The tariff topic continues to dominate and the fear of auto tariffs from the U.S. has helped to keep support in-play for USD at the 106.61 level and that’s equated to resistance in EUR/USD around 1.0500.
- The big takeaway right now for EUR/USD is deductive, where sellers have continually had an open door to take the pair down to fresh lows in February but have continually failed to do so. Bulls haven’t exactly taken away with matters as resistance holds around 1.0500, but that lack of bearish drive could soon lead to breakout potential in the pair.
- I’ll be looking into both EUR/USD and the U.S. Dollar in-depth in the Tuesday webinar, and you’re welcome to join. Click here for registration information.
The 1.0500 level has been a tricky spot so far for EUR/USD traders in 2025. The pair fell from that price on December 18th, the day of the last FOMC rate cut, and it was back in-play in late January as it helped to form an evening star pattern. That evening star held the highs until last Friday, when 1.0500 was back in the picture as resistance.
Between those two occurrences was a sell-off in the pair that was largely pushed by the threat of tariffs. Trump had announced in early-February that tariffs would be coming to Europe ‘pretty soon.’ And in the first week of the month he warned of reciprocal tariffs, which was largely implying a focus on European products. That threat of reciprocal tariffs helped EUR/USD to hold resistance at a confluent spot of Fibonacci levels, but the pullback from that resistance showed another higher-low, with buyers taking over a week later when details of the reciprocal tariffs actually hit the headlines.
While reciprocal tariffs could have a large impact on Europe, the fact that they were announced for an April 1st implementation date led many to think that it’s more of a negotiation tactic than an actual threat. The pair broke-out above the 1.0400 resistance as reciprocal tariffs were announced and that’s what helped to drive that 1.0500 test; the pullback of which held support at prior resistance on Wednesday of this week at the same 1.0400 handle.
I had talked about this setup in the Tuesday webinar and as I shared then, the 1.0400 area has held a higher-low with price pushing right back up to the 1.0500 handle.
EUR/USD Daily Price Chart

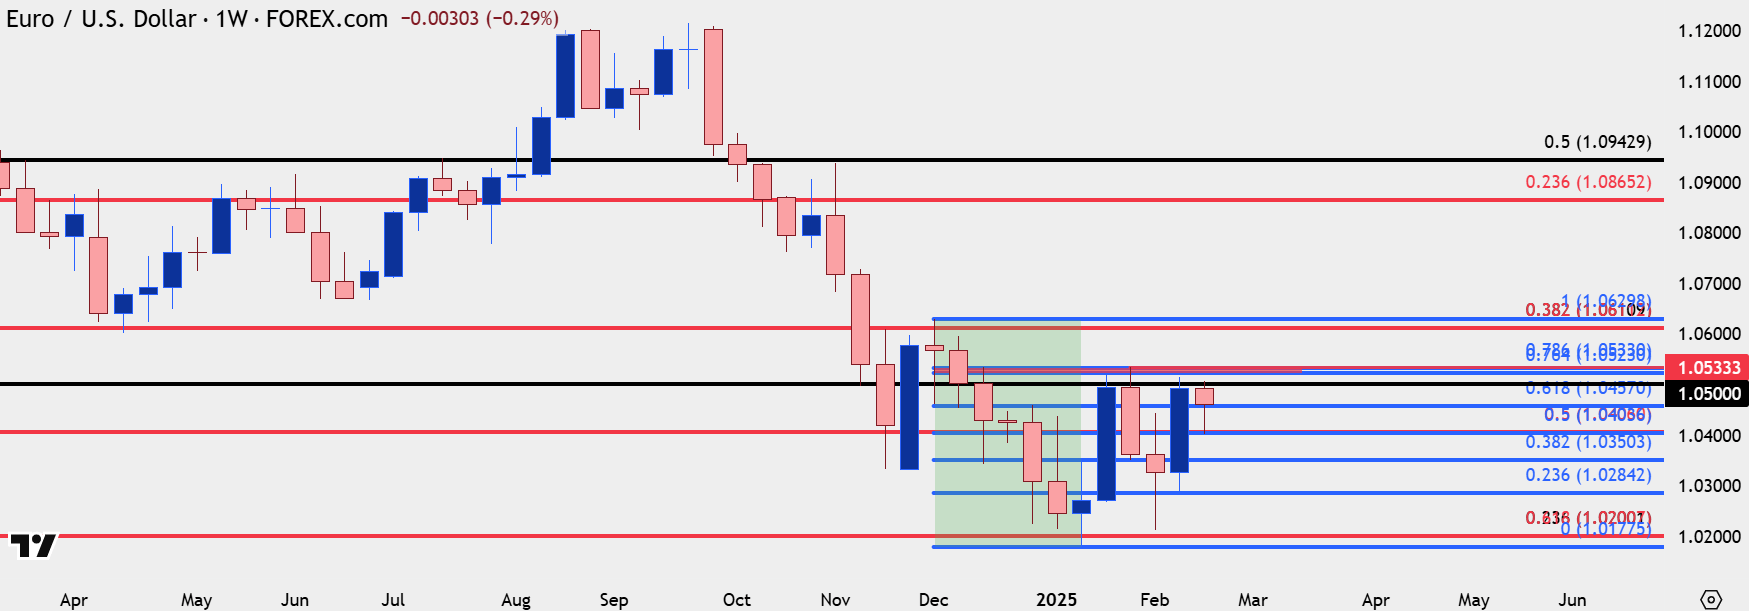
From the weekly chart we can see the importance of that 1.0500 level, which has held the highs in the pair since mid-December, the week of the FOMC rate decision. But more recently it’s the higher-lows that have printed, with prices holding above the 1.0200 inflection in January, even as tariff threats were getting priced-in earlier in February. This retains breakout potential in the pair and if bulls can grind above the 1.0500 handle, the next major level is the 1.0611 Fibonacci level that had set the highs in early-December, on the day of the NFP release.
EUR/USD Weekly Price Chart
--- written by James Stanley, Senior Strategist
Euro, EUR/USD Talking Points:
- EUR/USD battled the 1.0500 psychological level as the pair opened on Monday with resistance at the level and then found resistance there again on Thursday.
- The tariff topic continues to dominate and the fear of auto tariffs from the U.S. has helped to keep support in-play for USD at the 106.61 level and that’s equated to resistance in EUR/USD around 1.0500.
- The big takeaway right now for EUR/USD is deductive, where sellers have continually had an open door to take the pair down to fresh lows in February but have continually failed to do so. Bulls haven’t exactly taken away with matters as resistance holds around 1.0500, but that lack of bearish drive could soon lead to breakout potential in the pair.
- I’ll be looking into both EUR/USD and the U.S. Dollar in-depth in the Tuesday webinar, and you’re welcome to join. Click here for registration information.
The 1.0500 level has been a tricky spot so far for EUR/USD traders in 2025. The pair fell from that price on December 18th, the day of the last FOMC rate cut, and it was back in-play in late January as it helped to form an evening star pattern. That evening star held the highs until last Friday, when 1.0500 was back in the picture as resistance.
Between those two occurrences was a sell-off in the pair that was largely pushed by the threat of tariffs. Trump had announced in early-February that tariffs would be coming to Europe ‘pretty soon.’ And in the first week of the month he warned of reciprocal tariffs, which was largely implying a focus on European products. That threat of reciprocal tariffs helped EUR/USD to hold resistance at a confluent spot of Fibonacci levels, but the pullback from that resistance showed another higher-low, with buyers taking over a week later when details of the reciprocal tariffs actually hit the headlines.
While reciprocal tariffs could have a large impact on Europe, the fact that they were announced for an April 1st implementation date led many to think that it’s more of a negotiation tactic than an actual threat. The pair broke-out above the 1.0400 resistance as reciprocal tariffs were announced and that’s what helped to drive that 1.0500 test; the pullback of which held support at prior resistance on Wednesday of this week at the same 1.0400 handle.
I had talked about this setup in the Tuesday webinar and as I shared then, the 1.0400 area has held a higher-low with price pushing right back up to the 1.0500 handle.
EUR/USD Daily Price Chart
From the weekly chart we can see the importance of that 1.0500 level, which has held the highs in the pair since mid-December, the week of the FOMC rate decision. But more recently it’s the higher-lows that have printed, with prices holding above the 1.0200 inflection in January, even as tariff threats were getting priced-in earlier in February. This retains breakout potential in the pair and if bulls can grind above the 1.0500 handle, the next major level is the 1.0611 Fibonacci level that had set the highs in early-December, on the day of the NFP release.
EUR/USD Weekly Price Chart
--- written by James Stanley, Senior Strategist
Related tags:
Latest market news




Open an account in minutes
Experience award-winning platforms with fast and secure execution, and enjoy tight spreads from 0.5 pts on FX and 0.3 pts on indices.
Economic calendar
Web Trader platform
Our sophisticated web-based platform is packed with features.
Related articles

USD/JPY Bulls Continue to Push as Markets ‘Bet Against the House’
USD/JPY is now up by more than 500 pips from the low taken the day that Scott Bessent taunted markets, saying ‘you can bet against me if you want.’

Euro Short-term Outlook: EUR/USD Selloff Nears Critical Yearly Support 9 23 2026
Euro has fallen seven of the past nine sessions, with stretched momentum raising the stakes as EUR/USD closes in on a major inflection zone.


EUR/USD, Nasdaq Price Outlook: Reversal Risks Build
EUR/USD and Nasdaq Price Outlook: Overbought/oversold momentum on hourly and daily time frames is raising reversal risks across the U.S. dollar, EUR/USD and Nasdaq after a strong weekly advance.

This report is intended for general circulation only. It should not be construed as a recommendation, or an offer (or solicitation of an offer) to buy or sell any financial products. The information provided does not take into account your specific investment objectives, financial situation or particular needs. Before you act on any recommendation that may be contained in this report, independent advice ought to be sought from a financial adviser regarding the suitability of the investment product, taking into account your specific investment objectives, financial situation or particular needs.
StoneX Financial Pte. Ltd., may distribute reports produced by its respective foreign entities or affiliates within the StoneX group of companies or third parties pursuant to an arrangement under Regulation 32C of the Financial Advisers Regulations. Where the report is distributed to a person in Singapore who is not an accredited investor, expert investor or an institutional investor (as defined in the Securities Futures Act), StoneX Financial Pte. Ltd. accepts legal responsibility to such persons for the contents of the report only to the extent required by law. Singapore recipients should contact StoneX Financial Pte. Ltd. at 6826 9988 for matters arising from, or in connection with the report.
In the case of all other recipients of this report, to the extent permitted by applicable laws and regulations neither StoneX Financial Pte. Ltd. nor its associated companies will be responsible or liable for any loss or damage incurred arising out of, or in connection with, any use of the information contained in this report and all such liability is hereby expressly disclaimed. No representation or warranty is made, express or implied, that the content of this report is complete or accurate.
StoneX Financial Pte. Ltd. is not under any obligation to update this report.
Trading CFDs carries a high level of risk that may not be suitable for some investors. Consider your investment objectives, level of experience, financial resources, risk appetite and other relevant circumstances carefully. The possibility exists that you could lose some or all of your investments, including your initial deposits. If in doubt, please seek independent expert advice. Visit www.forex.com/en-sg/terms-and-policies for the complete Risk Disclosure Statement.