




European Open: Will the Dax be Next to Breakout?
Several benchmark indices closed above trend resistance yesterday, so today we find it if the DAX can play catch-up and close above its own key resistance level today.
Share this:


Asian Indices:
- Australia's ASX 200 index rose by 38.5 points (0.53%) and currently trades at 7,350.20
- Japan's Nikkei 225 index has risen by 407.76 points (1.43%) and currently trades at 28,957.11
- Hong Kong's Hang Seng index has risen by 218.17 points (0.87%) and currently trades at 25,180.76
UK and Europe:
- UK's FTSE 100 futures are currently up 15.5 points (0.22%), the cash market is currently estimated to open at 7,223.21
- Euro STOXX 50 futures are currently up 15.5 points (0.37%), the cash market is currently estimated to open at 4,164.56
- Germany's DAX futures are currently up 57 points (0.37%), the cash market is currently estimated to open at 15,519.72
US Futures:
- DJI futures are currently up 534.75 points (1.56%)
- S&P 500 futures are currently up 47.5 points (0.32%)
- Nasdaq 100 futures are currently up 14 points (0.32%)
Indices: FTSE confirms reversal pattern, eyes on the DAX
Along with global indices in general, the FTSE 100 finally broke higher yesterday in line with investor’s appetite for risk. Invalidating trend resistance, an inverted head and shoulders pattern was confirmed which projects a target around 7500. The next major resistance levels for bulls to conquer is the August high at 7224.46 and, if this is a real breakout, we would not want to see prices trade back beneath yesterday’s low.
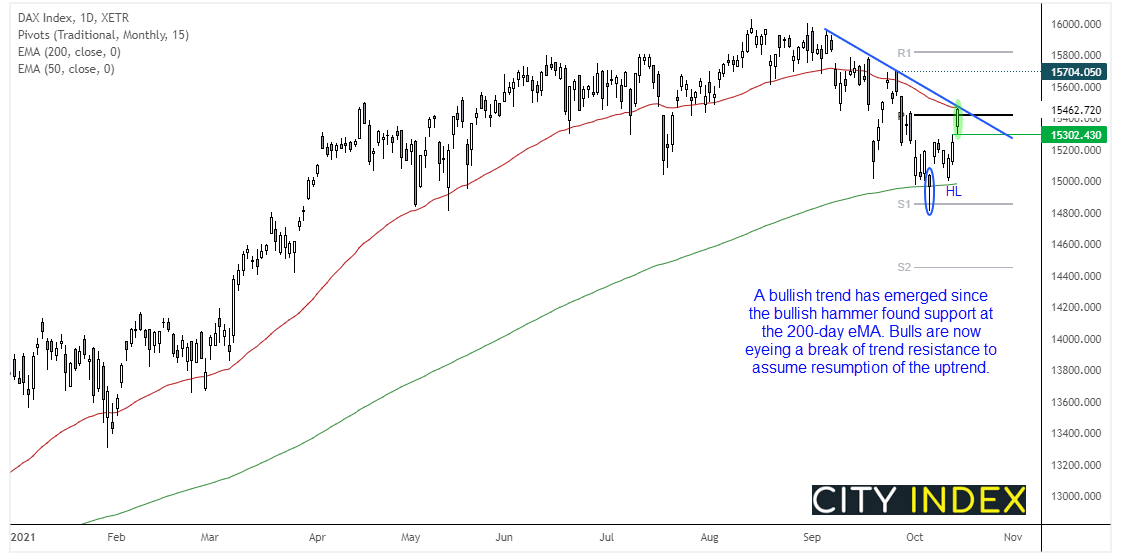

We’re now waiting to see if the DAX can follow suit and break trend resistance, like the S&P 500 and FTSE 100 did. The daily chart closed at the high of the day although resistance was found at the 50-day eMA and trend resistance. This provides a pivotal level, but if we see a gap higher then our bias remains bullish above yesterday’s low around 15,300.
S&P 500 earnings scheduled for today
- Q3 2021 Prologis Inc (PLD) Earnings Release
- Q3 2021 PNC Financial (PNC) Services Group Inc Earnings Release
View today’s video: Under the Microscope: E-mini S&P Futures
FTSE 350: Market Internals


FTSE 350: 4125.65 (0.92%) 14 October 2021
- 289 (82.34%) stocks advanced and 58 (16.52%) declined
- 8 stocks rose to a new 52-week high, 4 fell to new lows
- 56.7% of stocks closed above their 200-day average
- 41.88% of stocks closed above their 50-day average
- 15.38% of stocks closed above their 20-day average
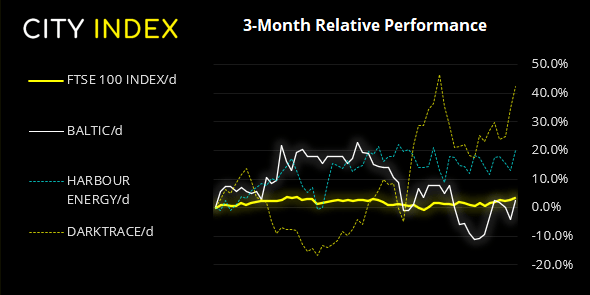
Outperformers:
- + 7.0% - Baltic Classifieds Group PLC (BCG.L)
- + 6.2% - Harbour Energy PLC (HBR.L)
- + 5.8% - Darktrace PLC (DARK.L)
Underperformers:
- ·-13.2% - Qinetiq Group PLC (QQ.L)
- ·-4.15% - Domino's Pizza Group PLC (DOM.L)
- ·-3.12% - Close Brothers Group PLC (CBRO.L)
Forex: Consumer sentiment, retail sales and inflation expectations in focus
Trends established yesterday extended their reach overnight. The New Zealand dollar remained the dominant force in the FX space whilst the yen was offloaded across the board, with the only difference being that volatility was not as fierce.
The baulk of today’s data worth a mention is in the US session. Import prices are an inflationary input, so any rise or fall here is a proxy for factory gate prices. Retail sales is a proxy for consumer demand, with both data sets scheduled for 13:30 BST. Then at 15:00 we have the preliminary University of Michigan Survey which includes consumer sentiment and inflation expectations.
Whilst September’s consumer confidence print had nudged its way higher, the August read had plummet (somewhat suddenly) to a 10-year low. Therefore, another weak confidence print today could ruffle a few bullish/hawkish feathers if it breaks to new lows.
And then there’s consumer inflation expectations which remain near multi-decade highs. Whilst consumers are not generally credit with their forecasting abilities, they will change their spending habits if they believe prices will change in future, so policy makers track what they think. And should inflation expectations continue to rise it’s another tick on the ‘hurry up and tighten policy’ box for the Fed.
Commodities: Commodities broadly higher
WTI continues to move higher, yet volume is low to show a lack of commitment from the bull camp. A trend needs volume to be sustained, so without fresh buyers stepping in we suspect a correction (or pause in trend) could be due over the near-term.
Gold trades around 1795 near its 200-day eMA after printing an indecision candle yesterday. The longer it stays below 1800 the greater the odds of a pullback, but if it can break to new highs then the next resistance level is around 1820 (monthly R1 pivot). Falling TIPS (proxy for real rates) are falling which can be beneficial for gold prices.
Platinum is now above its 200-day eMA after rising to a 10-week high yesterday. We retain our bullish bias above 997.
Up Next (Times in BST)
How to trade with City Index
You can trade easily trade with City Index by using these four easy steps:
- Open an account, or log in if you’re already a customer
• Open an account in the UK
• Open an account in Australia
• Open an account in Singapore
- Search for the company you want to trade in our award-winning platform
- Choose your position and size, and your stop and limit levels
- Place the trade
How to trade with FOREX.com
Follow these easy steps to start trading with FOREX.com today:
- Open a Forex.com account, or log in if you’re already a customer.
- Search for the pair you want to trade in our award-winning platform.
- Choose your position and size, and your stop and limit levels.
- Place the trade.


Open an account in minutes
Experience award-winning platforms with fast and secure execution, and enjoy tight spreads from 0.5 pts on FX and 0.3 pts on indices.
Economic calendar
Web Trader platform
Our sophisticated web-based platform is packed with features.
Related articles
British Pound Technical Outlook: GBP/USD Rebound Challenges September Downtrend 9 30 2026
Sterling has rallied sharply from key support, with GBP/USD at an inflection point that could determine whether a larger recovery is underway.

EUR/USD forecast: Eurozone stagflation risks mount as dollar holds firm ahead of data
The dollar was bouncing back at the time of writing, after it had eased overnight on the back of some weaker-than-expected economic data yesterday which had prompted markets to scale back expectations of an October Fed rate hike. However, with more significant US data due today and Friday, and with oil prices continuing to remain elevated, the dollar’s broader direction remains bullish.


Treasury Yields Lose Momentum as Energy ETF Retreats
The 10-year Treasury yield is testing a resistance zone respected since the 1920s, as bearish RSI divergence signals fading upside momentum.

This report is intended for general circulation only. It should not be construed as a recommendation, or an offer (or solicitation of an offer) to buy or sell any financial products. The information provided does not take into account your specific investment objectives, financial situation or particular needs. Before you act on any recommendation that may be contained in this report, independent advice ought to be sought from a financial adviser regarding the suitability of the investment product, taking into account your specific investment objectives, financial situation or particular needs.
StoneX Financial Pte. Ltd., may distribute reports produced by its respective foreign entities or affiliates within the StoneX group of companies or third parties pursuant to an arrangement under Regulation 32C of the Financial Advisers Regulations. Where the report is distributed to a person in Singapore who is not an accredited investor, expert investor or an institutional investor (as defined in the Securities Futures Act), StoneX Financial Pte. Ltd. accepts legal responsibility to such persons for the contents of the report only to the extent required by law. Singapore recipients should contact StoneX Financial Pte. Ltd. at 6826 9988 for matters arising from, or in connection with the report.
In the case of all other recipients of this report, to the extent permitted by applicable laws and regulations neither StoneX Financial Pte. Ltd. nor its associated companies will be responsible or liable for any loss or damage incurred arising out of, or in connection with, any use of the information contained in this report and all such liability is hereby expressly disclaimed. No representation or warranty is made, express or implied, that the content of this report is complete or accurate.
StoneX Financial Pte. Ltd. is not under any obligation to update this report.
Trading CFDs carries a high level of risk that may not be suitable for some investors. Consider your investment objectives, level of experience, financial resources, risk appetite and other relevant circumstances carefully. The possibility exists that you could lose some or all of your investments, including your initial deposits. If in doubt, please seek independent expert advice. Visit www.forex.com/en-sg/terms-and-policies for the complete Risk Disclosure Statement.