



For how much longer will the ASX200 rotate around 6000 for
A sea of red last Friday as the ASX200 fell 3%, closing at 5925. Although the selloff was broad-based, the local high growth technology sector experienced heavier falls (-5.59%), mirroring the move in U.S. tech shares that succumbed to a heavy bout of profit-taking on Thursday night.
Share this:
After falling another 0.95% in early trading this morning, a rally in bank and mining stocks has helped the ASX200 claw back into positive territory. Providing yet another example of the magnetic effect of the 6000 level and, prompting the question “for how much longer will the ASX200 rotate around 6000 for?”
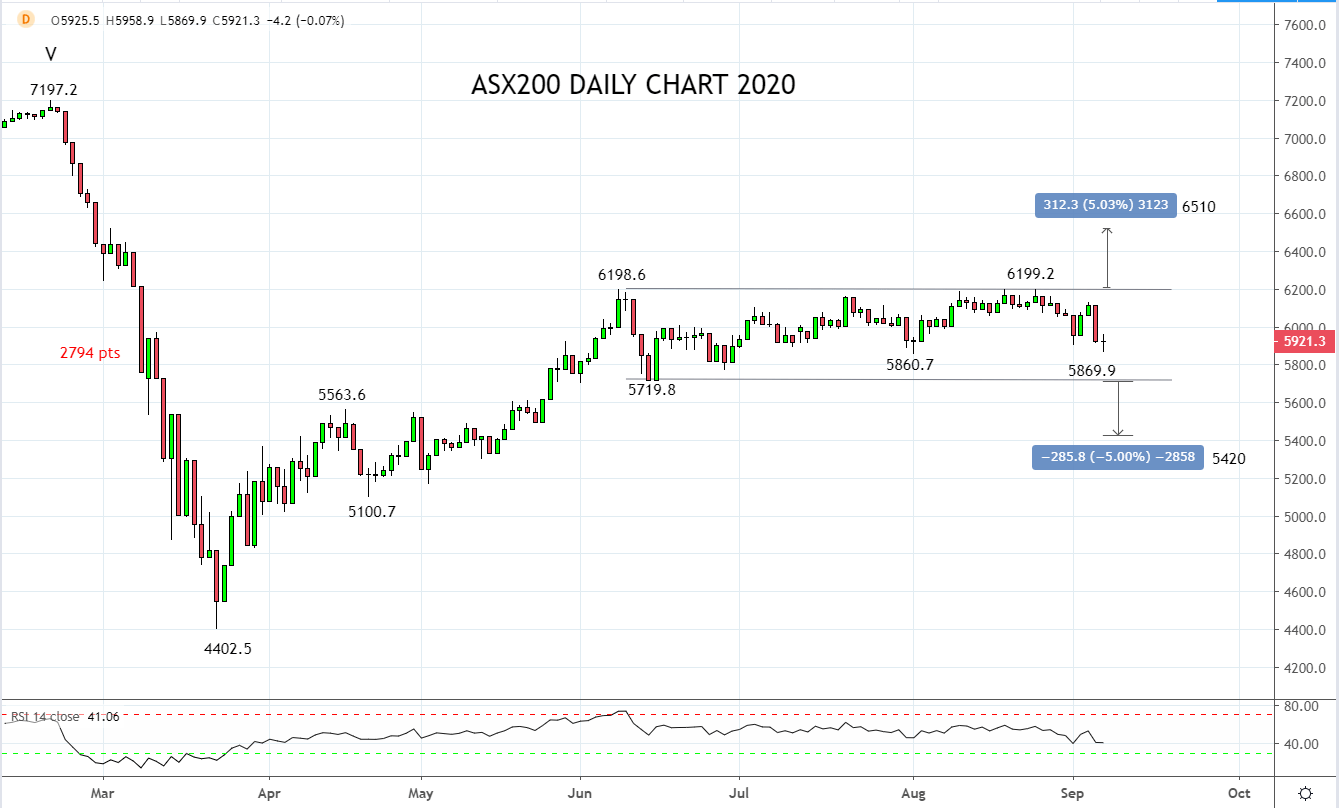
As those who have been waiting for the ASX200 to play some catch up to the U.S equity market would know, 6200 has been an unbreakable wall of resistance. On the downside, dips towards 5800/5700 have been well supported - a pattern of range trading that has been in place since early June.
In over 25 years of watching the ASX200, I can only recall one other time the ASX200 was encapsulated within a range like this, back in 2017. Then like now, the range trading commenced in early June. The break out from the range did not come until Mid-October, 120 days later!
This particular period was behind our thinking in two articles we wrote in May here outlining expectations for consolidation in ASX200. As it turned out, the articles were written just a few weeks too early.
Using 2017 as a template the ASX200 can rotate either side of 6000 for another month. When the break does finally come the move is expected to be dynamic, somewhere in the vicinity of 5% reasonably quickly. In which direction, we are open minded.
Using this as a guideline, should the ASX200 make a sustained break above 6200, it would be considered as a buy signal, looking for a move towards 6500 as momentum/technical buyers step in. Alternatively, should the ASX200 see a sustained break below 5700, the downside projection is 5400.
Source Tradingview. The figures stated areas of the 7th of September 2020. Past performance is not a reliable indicator of future performance. This report does not contain and is not to be taken as containing any financial product advice or financial product recommendation
Latest market news




Open an account in minutes
Experience award-winning platforms with fast and secure execution, and enjoy tight spreads from 0.5 pts on FX and 0.3 pts on indices.
Economic calendar
Web Trader platform
Our sophisticated web-based platform is packed with features.
Related articles

ASX 200 Rebound Stalls Despite Wall Street Surge
The ASX 200 rebound is struggling for traction despite a powerful Wall Street rally, leaving 8800 resistance and downside risks in focus.

ASX 200 Rebounds, But Resistance Looms
The ASX 200 has rebounded from the July low, but resistance around 8800 and 8875 could test the recovery.

ASX 200 Slides as Oil, Yields and Rate Risks Hit Sentiment
The ASX 200 suffered its worst week in six months as surging oil, higher bond yields and renewed rate-hike bets drove a broad risk-off move.
This report is intended for general circulation only. It should not be construed as a recommendation, or an offer (or solicitation of an offer) to buy or sell any financial products. The information provided does not take into account your specific investment objectives, financial situation or particular needs. Before you act on any recommendation that may be contained in this report, independent advice ought to be sought from a financial adviser regarding the suitability of the investment product, taking into account your specific investment objectives, financial situation or particular needs.
StoneX Financial Pte. Ltd., may distribute reports produced by its respective foreign entities or affiliates within the StoneX group of companies or third parties pursuant to an arrangement under Regulation 32C of the Financial Advisers Regulations. Where the report is distributed to a person in Singapore who is not an accredited investor, expert investor or an institutional investor (as defined in the Securities Futures Act), StoneX Financial Pte. Ltd. accepts legal responsibility to such persons for the contents of the report only to the extent required by law. Singapore recipients should contact StoneX Financial Pte. Ltd. at 6826 9988 for matters arising from, or in connection with the report.
In the case of all other recipients of this report, to the extent permitted by applicable laws and regulations neither StoneX Financial Pte. Ltd. nor its associated companies will be responsible or liable for any loss or damage incurred arising out of, or in connection with, any use of the information contained in this report and all such liability is hereby expressly disclaimed. No representation or warranty is made, express or implied, that the content of this report is complete or accurate.
StoneX Financial Pte. Ltd. is not under any obligation to update this report.
Trading CFDs carries a high level of risk that may not be suitable for some investors. Consider your investment objectives, level of experience, financial resources, risk appetite and other relevant circumstances carefully. The possibility exists that you could lose some or all of your investments, including your initial deposits. If in doubt, please seek independent expert advice. Visit www.forex.com/en-sg/terms-and-policies for the complete Risk Disclosure Statement.