





fx analysis and technical outlook 9 1792502016
<p>Key Economic Events and Releases Next Week Tuesday (12 Jan): – GBP – UK Manufacturing Production Wednesday (13 Jan): – CNY – China Trade Balance […]</p>
Share this:

Key Economic Events and Releases Next Week
Tuesday (12 Jan):
- GBP – UK Manufacturing Production
Wednesday (13 Jan):
- CNY – China Trade Balance
- CAD – US Crude Oil Inventories
Thursday (14 Jan):
- AUD – Australia Employment Change
- AUD – Australia Unemployment Rate
- EUR – ECB Monetary Policy Meeting Accounts
- EUR – Eurogroup Meetings
- GBP – Bank of England MPC Official Bank Rate Votes
- GBP – Bank of England Monetary Policy Summary
- GBP – Bank of England Official Bank Rate
- USD – US Unemployment Claims
- USD – FOMC Member Bullard Speech
Friday (15 Jan):
- USD – US Retail Sales and Core Retail Sales
- USD – US Producer Price Index and Core Producer Price Index
- USD – FOMC Member Dudley Speech
- USD – Industrial Production
- USD – Preliminary University of Michigan Consumer Sentiment
Technical Developments
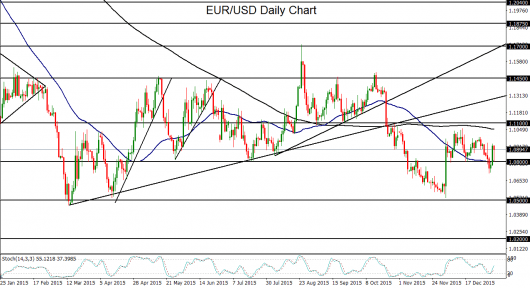
- EUR/USD has struggled to find direction with the heightened global volatility of the past week but should remain bearish on any re-break below 1.0800 support. Technical bias: Neutral to Moderately Bearish.
- GBP/USD has continued to follow-through on its sharply bearish momentum, recently hitting a new multi-year low. Technical bias: Bearish.
- USD/JPY has plunged on yen safe haven flows in the midst of turmoil in the global equity markets, and could fall further if China’s financial/economic woes continue to weigh on the markets. Technical bias: Moderately Bearish.
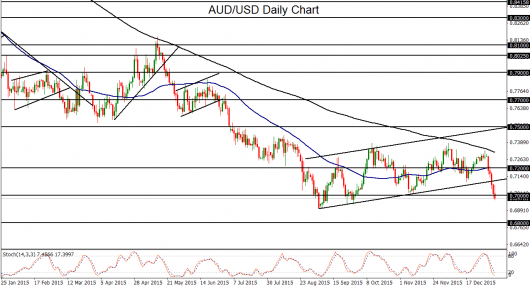
- AUD/USD has tentatively dropped below 0.7000 as problems in Chinese markets have pressured the China-linked Australian dollar. Technical bias: Bearish.
EUR/USD
This past week, the first trading week of the New Year, saw some whipsaw volatility for EUR/USD as it struggled to find a sustained direction. The beginning of the week was moderately bearish, as the euro fell on lower-than-expected inflation data from euro area countries and the dollar experienced a surge in the very beginning of the year. This caused a tentative breakdown below key 1.0800 support. The drop reversed course back above 1.0800 by mid-week, however, as the dollar pulled back due to concerns that low inflation and the global economy, especially in China, might prompt the Fed to postpone a second rate hike. Friday’s Non-Farm Payrolls report, which far exceeded expectations at 292,000 jobs added against prior expectations of 203,000, caused an initial surge in the dollar once again, as it provided some additional impetus for a sooner rate hike. Despite these fluctuations throughout this past week, the longer-term directional bias for EUR/USD remains bearish in light of continuing divergent monetary policy between the Fed and ECB, as well as the clear long-term downtrend for the currency pair. If EUR/USD manages to re-break below the key 1.0800 level and 50-day moving average, the next major downside target remains around the 1.0500 support level, which was last approached in early December.
GBP/USD
This past week has clearly been bearish for GBP/USD, which has essentially remained in freefall from mid-December. Despite the midweek pull back for the US dollar, GBP/USD mostly persisted in a staunchly bearish stance as the pound continued to founder on the Bank of England’s (BoE) indeterminate monetary tightening timeline. With the Fed having already begun raising rates in December and presumably on track for more hike(s) this year, and the BoE still uncertain as to its own monetary tightening cycle, further losses could potentially be in store for GBP/USD. The better-than-expected US Non-Farm Payrolls data on Friday contributed to even further downside momentum for the currency pair, as the dollar strengthened due to expectations that solid employment should encourage a more hawkish Fed. Next week brings the BoE’s Monetary Policy Summary, which should provide further clues as to how close (or not) the BoE may be to raising interest rates in the UK. Currently, GBP/USD has tentatively broken down below its major support target around the key 1.4600 level, which is roughly where the currency pair bottomed out last April. In the process, it has established a new 5½-year low. On any sustained trading below 1.4600, GBP/USD could continue its downside momentum towards further multi-year lows, with the next major downside targets at the 1.4500 level followed by the key 1.4250 support area.
USD/JPY
With the exception of Friday, the past week has been intensely bearish for USD/JPY. This occurred as a flight to the Japanese yen safe haven ensued after turmoil in the global equity markets was sparked by China’s financial and economic woes. On Friday morning, however, a slight measure of stability initially returned to stock markets in China, Europe, and the US, and the US dollar regained a bit of traction on a highly positive NFP report. This prompted an initial rebound for USD/JPY. Prior to this rebound, stock market volatility had pushed USD/JPY below key support around the 118.00 level. Despite this tentative stabilization, however, China’s economy and financial markets remain highly vulnerable. In the event of further equity market volatility in China that continues to spill over into other major financial markets, another flight to the yen could very well ensue. With any sustained trading below the noted 118.00 level, the next major downside target is at the 116.00 support level, last hit one year ago at the beginning of 2015.
AUD/USD
The first trading week of the New Year has seen nothing but pressure for AUD/USD. An exceptionally sharp slide occurred this week as China’s financial and economic troubles weighed heavily on the China-linked Australian dollar. This pressure has culminated in the currency pair breaking down below an important uptrend support line extending back to September’s 6-year low around 0.6900, and hitting major psychological support at the 0.7000 level. Having currently broken down below this 0.7000 level after positive US jobs data propped up the US dollar and continued worries over China weighed on the Australian dollar, AUD/USD could have significantly further to fall. Under the noted 0.7000 psychological support level, the next major support target is at the key 0.6800 level, which would confirm a continuation of the sharp and longstanding bearish trend.
Related tags:
Latest market news




Open an account in minutes
Experience award-winning platforms with fast and secure execution, and enjoy tight spreads from 0.5 pts on FX and 0.3 pts on indices.
Economic calendar
Web Trader platform
Our sophisticated web-based platform is packed with features.
Related articles
This report is intended for general circulation only. It should not be construed as a recommendation, or an offer (or solicitation of an offer) to buy or sell any financial products. The information provided does not take into account your specific investment objectives, financial situation or particular needs. Before you act on any recommendation that may be contained in this report, independent advice ought to be sought from a financial adviser regarding the suitability of the investment product, taking into account your specific investment objectives, financial situation or particular needs.
StoneX Financial Pte. Ltd., may distribute reports produced by its respective foreign entities or affiliates within the StoneX group of companies or third parties pursuant to an arrangement under Regulation 32C of the Financial Advisers Regulations. Where the report is distributed to a person in Singapore who is not an accredited investor, expert investor or an institutional investor (as defined in the Securities Futures Act), StoneX Financial Pte. Ltd. accepts legal responsibility to such persons for the contents of the report only to the extent required by law. Singapore recipients should contact StoneX Financial Pte. Ltd. at 6826 9988 for matters arising from, or in connection with the report.
In the case of all other recipients of this report, to the extent permitted by applicable laws and regulations neither StoneX Financial Pte. Ltd. nor its associated companies will be responsible or liable for any loss or damage incurred arising out of, or in connection with, any use of the information contained in this report and all such liability is hereby expressly disclaimed. No representation or warranty is made, express or implied, that the content of this report is complete or accurate.
StoneX Financial Pte. Ltd. is not under any obligation to update this report.
Trading CFDs carries a high level of risk that may not be suitable for some investors. Consider your investment objectives, level of experience, financial resources, risk appetite and other relevant circumstances carefully. The possibility exists that you could lose some or all of your investments, including your initial deposits. If in doubt, please seek independent expert advice. Visit www.forex.com/en-sg/terms-and-policies for the complete Risk Disclosure Statement.