





fx volatility and the no vote 805942015
<p>In the wake of the resounding ‘No’ vote that resulted from Sunday’s Greek referendum, the currency markets opened the trading week in a highly tense […]</p>
Share this:

In the wake of the resounding ‘No’ vote that resulted from Sunday’s Greek referendum, the currency markets opened the trading week in a highly tense and volatile state. In what appears to be almost a repeat of last week’s open, major currency pairs like EUR/USD and USD/JPY saw considerable price gaps to the downside on fears and uncertainty surrounding Greece and its very tenuous relationship with the euro. Here’s a quick rundown of some major currency pairs and their reactions:
EUR/USD
After closing last week above 1.1100, EUR/USD gapped lower to open the new trading week slightly below the 1.1000 level. While this gap was subsequently filled to the upside on a rebound, as occurred after last week’s down-gap, the directional bias for the embattled currency pair remains technically bearish. Last week’s gap-fill rebound was followed by a prompt retreat that reinstated heightened volatility for the currency pair. This could also be the case for the current week, as the outcome of the Greek referendum places the euro at continued risk and uncertainty.
Overall, EUR/USD remains weak and weighted down within a strong bearish trend on both a long-term and short-term basis. The long-term downtrend has been in place for the past 14 months, since the May 2014 highs near 1.4000. The short-term downtrend began around June’s retreat from 1.1400-area resistance.
As confusion and ambiguity persist with regard to the euro, and if EUR/USD continues to trade under 1.1100-area resistance, the next major downside targets are at the 1.0800 and 1.0500 support objectives. With the 1.0500 level being in the vicinity of the currency pair’s March 12-year low, and also the recent site of a rough double-bottoming pattern, any breakdown below that support area would confirm a continuation of the longstanding bearish trend.
USD/JPY
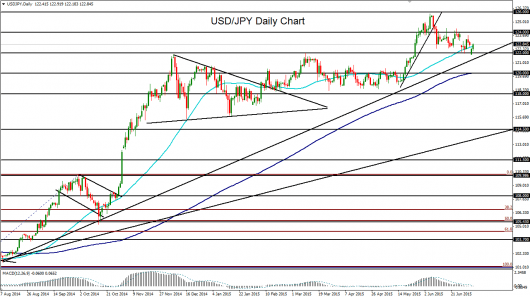
USD/JPY also began the week with a gap to the downside. Tied to a ‘flight-to-safety’ surge in yen strength on the open, USD/JPY initially gapped slightly below key support at the 122.00 level. The past week saw heightened volatility above this major support level, but the level was ultimately defended vigorously on each day that it was challenged. The gap down on this week’s opening was quickly followed by yet another defense, as the currency pair quickly rebounded to fill the gap and trade above 122.00 once again.
From a longer-term perspective, USD/JPY is still well-entrenched within a multi-year uptrend that has lifted it from its lows below 80.00 in 2012 up to a 13-year high that approached the 126.00 upside target in early June. Since that high, the currency pair has spent the past month in a pullback and consolidation mode with key downside support around the noted 122.00 level.
While the overall trend continues to remain convincingly bullish, short-term risk sentiment could prompt a further environment of risk aversion and corresponding spurts of yen strength. In this event, USD/JPY could potentially trade to the downside in a further pullback towards 120.00-area support. Any continued rebound in the absence of this substantial pullback has a clear upside target around the noted 124.00-area resistance level.
GBP/USD
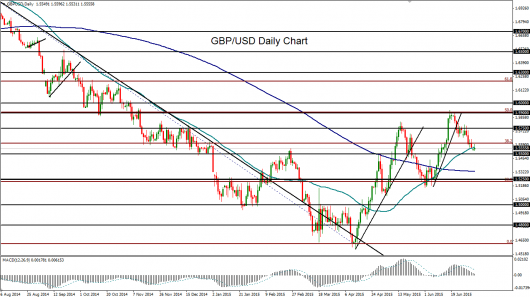
GBP/USD did not see much of a substantial reaction on the week’s open to Sunday’s Greek vote, aside from a small downside gap on the open, but continues to trade in a sharp decline from June’s year-to-date high of 1.5928. The current pullback from that high has now reached back down to the key 50-day moving average, and continues to carry a moderately bearish trend bias. The decline since June’s high has also now retraced down around 50% of the last bullish run from the low of 1.5170 in early June to the noted 2015 high of 1.5928 later in June.
Opening the trading week just above the key downside support target of 1.5500, GBP/USD could well have further to pullback within the context of the longer-term bearish trend that extends back to the five-year high of 1.7190 in July of 2014, as well as the short-term bearish trend from mid-June.
Currently in close focus to the downside is the previously-cited target at the major 1.5500 support level. A further downside pullback target on any breakdown below 1.5500 resides around the key 1.5200 support area.
AUD/USD
This past Friday saw an exceptional slide that pushed the AUD/USD down to closely approach its original downside target at 0.7500. This breakdown to new lows has confirmed a continuation of the year-long downtrend that has been in place since the intermediate 0.9500-area high in July of 2014. In the process, the currency pair has established a new six-year low.
This week’s open saw a modest gap down to dip even lower, below the noted 0.7500 support target, to establish a new multi-year low around 0.7462. A rebound shortly after the open then attempted a gap fill to the upside.
Prior to this low being hit, AUD/USD formed a large bearish flag pattern that spanned much of June. A breakdown then occurred in late June, pushing the currency pair into the current bearish continuation below the prior multi-year low of 0.7532 that was established in early April.
While a rebound after the current downside extension could well occur, the trend bias for AUD/USD remains bearish, with any further slide below 0.7500 targeting the next major downside target around the key 0.7300 support level.
Related tags:




Open an account in minutes
Experience award-winning platforms with fast and secure execution, and enjoy tight spreads from 0.5 pts on FX and 0.3 pts on indices.
Economic calendar
Web Trader platform
Our sophisticated web-based platform is packed with features.
Related articles
This report is intended for general circulation only. It should not be construed as a recommendation, or an offer (or solicitation of an offer) to buy or sell any financial products. The information provided does not take into account your specific investment objectives, financial situation or particular needs. Before you act on any recommendation that may be contained in this report, independent advice ought to be sought from a financial adviser regarding the suitability of the investment product, taking into account your specific investment objectives, financial situation or particular needs.
StoneX Financial Pte. Ltd., may distribute reports produced by its respective foreign entities or affiliates within the StoneX group of companies or third parties pursuant to an arrangement under Regulation 32C of the Financial Advisers Regulations. Where the report is distributed to a person in Singapore who is not an accredited investor, expert investor or an institutional investor (as defined in the Securities Futures Act), StoneX Financial Pte. Ltd. accepts legal responsibility to such persons for the contents of the report only to the extent required by law. Singapore recipients should contact StoneX Financial Pte. Ltd. at 6826 9988 for matters arising from, or in connection with the report.
In the case of all other recipients of this report, to the extent permitted by applicable laws and regulations neither StoneX Financial Pte. Ltd. nor its associated companies will be responsible or liable for any loss or damage incurred arising out of, or in connection with, any use of the information contained in this report and all such liability is hereby expressly disclaimed. No representation or warranty is made, express or implied, that the content of this report is complete or accurate.
StoneX Financial Pte. Ltd. is not under any obligation to update this report.
Trading CFDs carries a high level of risk that may not be suitable for some investors. Consider your investment objectives, level of experience, financial resources, risk appetite and other relevant circumstances carefully. The possibility exists that you could lose some or all of your investments, including your initial deposits. If in doubt, please seek independent expert advice. Visit www.forex.com/en-sg/terms-and-policies for the complete Risk Disclosure Statement.