



Japanese Yen Technical Analysis: USD/JPY Support Test into Core PCE
USD/JPY has been a battlefield for the past two months as the force of intervention and the threat of more have given sellers an advantage, even as buyers have continued to bid support on pullbacks. This sets the stage for a massive finish to the week with Core PCE and Non-farm Payrolls.
Share this:

USD/JPY Talking Points:
- It’s been a dichotomous backdrop in USD/JPY, as longer-term charts illustrate a clear shift into a more bearish backdrop but on a shorter-term look, bulls have continued to pile in after pullbacks.
- Last week saw a resistance test at 159 and that drove a pullback to a support level at 156.68. That level gave a 100+ pip bounce yesterday, but noticeably, bulls haven’t continued the push. A heavy dose of data in the back-half of the week may have something to do with that.
One look at the weekly chart and it’s clear that a shift has shown up recently in the USD/JPY pair. And, really, over the past five years there’s been a similar push-pull dynamic of ‘up the stairs, down the elevator.’
That can largely be drawn back to positioning, as a crowded trade sees incremental gains on the way up, with buyers testing and testing as each fresh high prints; while the exit door brings a furious retracement driven by the prospect of change. In 2022, 2023 and 2024, that change was in the form of weakening inflation hitting Fed rate hike and then rate cut expectations. More recently, since July, that’s been due to a dual intervention from the U.S. and Japan.
But, as I pointed out after that first intervention run, when prices were pushing towards the 155.00 level, there was still motive for longs and through the month of August, that’s what showed up as buyers pushed all the way back to the 160.00 level. Another swing developed shortly after that and this time, prices pushed down to the 153 level. And, again, buyers loaded up and prices ran for 600 pips until last week’s test and stall at the 159.00 level.
USD/JPY Daily Chart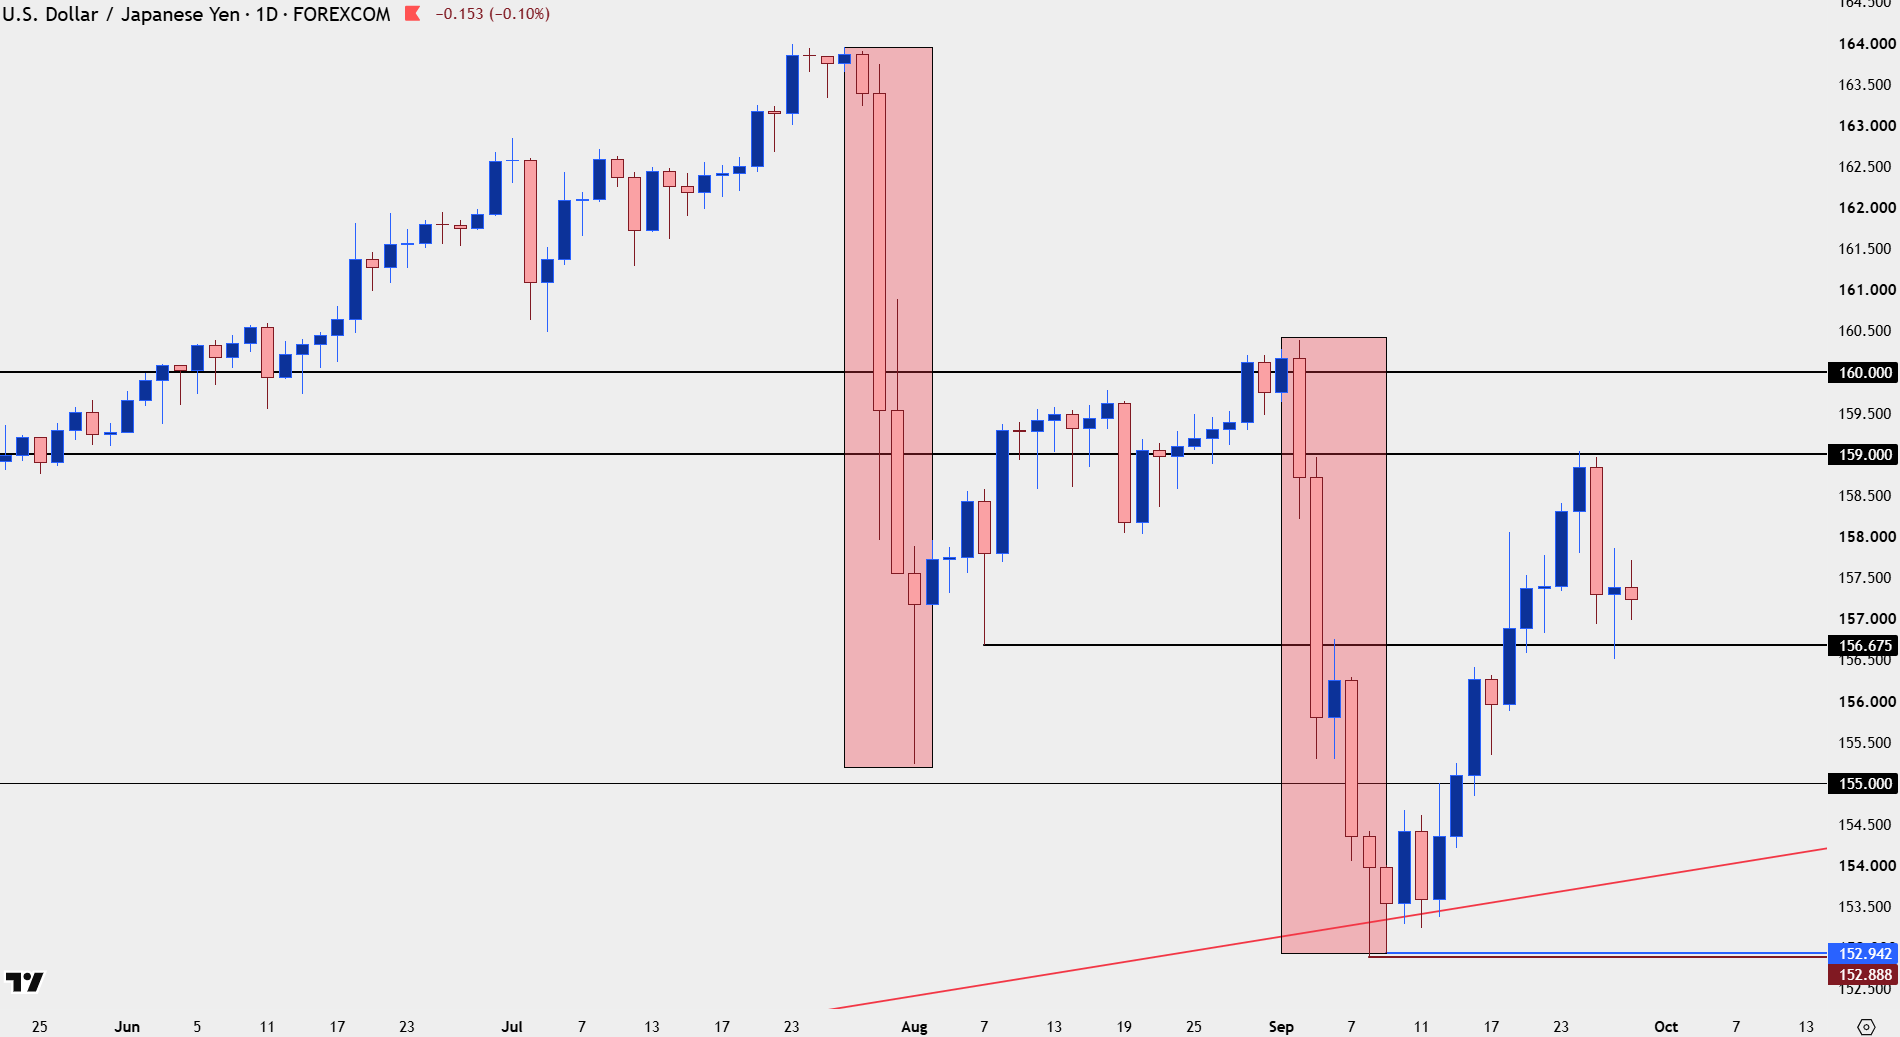
Chart prepared by James Stanley; data derived from Tradingview
USD/JPY Shorter-Term
Last week saw both the US and Japan comment on Japanese spot rates, which was one of the factors behind the 250+ pip retracement. And while both would surely like a lower spot rate, that’s been the case for the past two months and perhaps the larger question is whether there’s enough fear of change in the environment to compel longer-term bulls to pare positions.
After all, this was what was behind retracements in 2022, 2023 and 2024 – as weakening CPI drove the fear that the Fed would go less hawkish and then, eventually dovish into a rate cut. We haven’t quite had that situation of late as US inflation is expected to come in at 3.5% tomorrow, which still outpaces inflation in Japan.
There could be another factor, however, as Japan is more vulnerable to surging oil prices as they’re forced to import all of their oil, and a sliding Yen to go along with higher oil prices makes that threat of future inflation an even larger factor.
For tomorrow, however, the focus is much more to the point, as Core PCE in the United States will likely have some form of direct relationship on the pair, with stronger inflation leading to higher odds of more US rate hikes, which further exposes that deviation between the US and Japan.
At this point, USD/JPY is holding support at a key zone, the same 156.68 that was in-play late last week synced up to 157.22. From the daily above, this has an open door for bullish continuation. But – for those that are bearish there could be a justification that I’ll look at a little lower.
USD/JPY Four-Hour Price Chart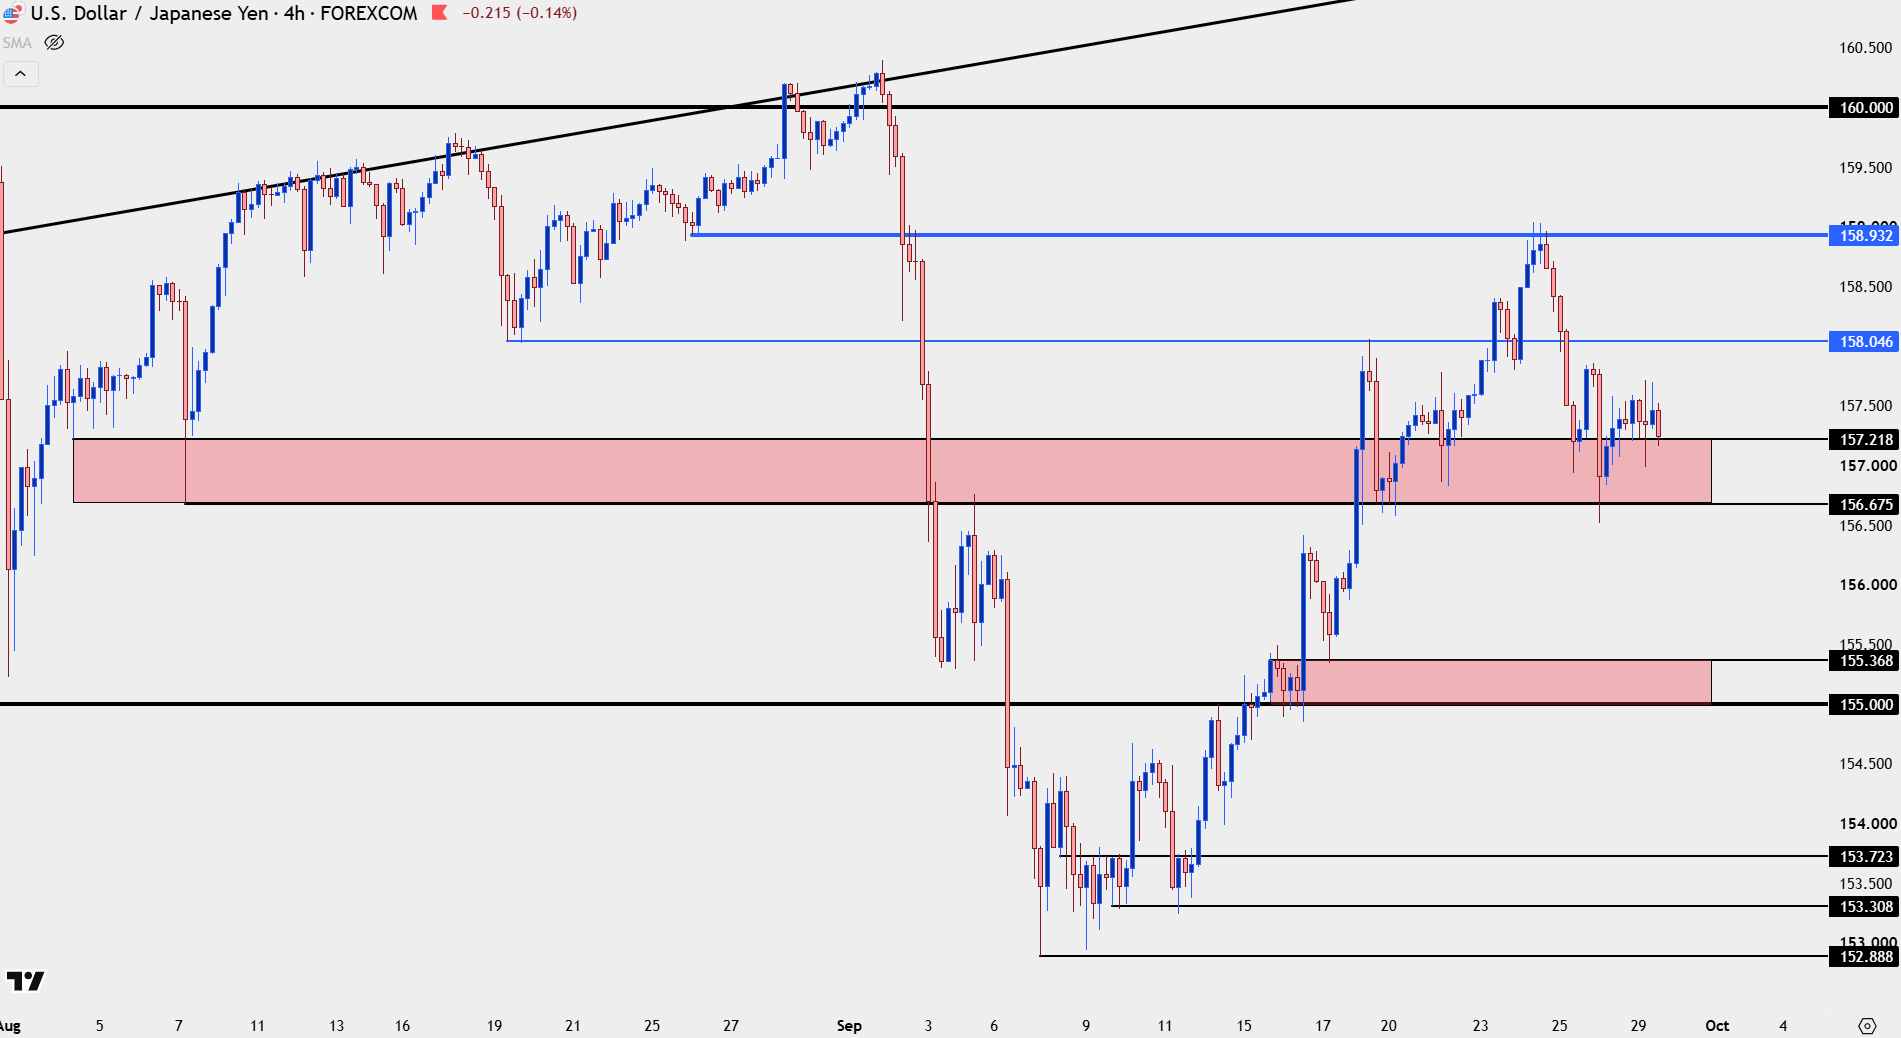
Chart prepared by James Stanley; data derived from Tradingview
USD/JPY Shorter-Term
At this point there’s a head and shoulders formation that’s set up on shorter-term charts. This would require a break of last week’s low to trigger, and if it does, that projects to a move of approximately 250 pips, which would point to around the 154 level on the pair.
USD/JPY Two-Hour Chart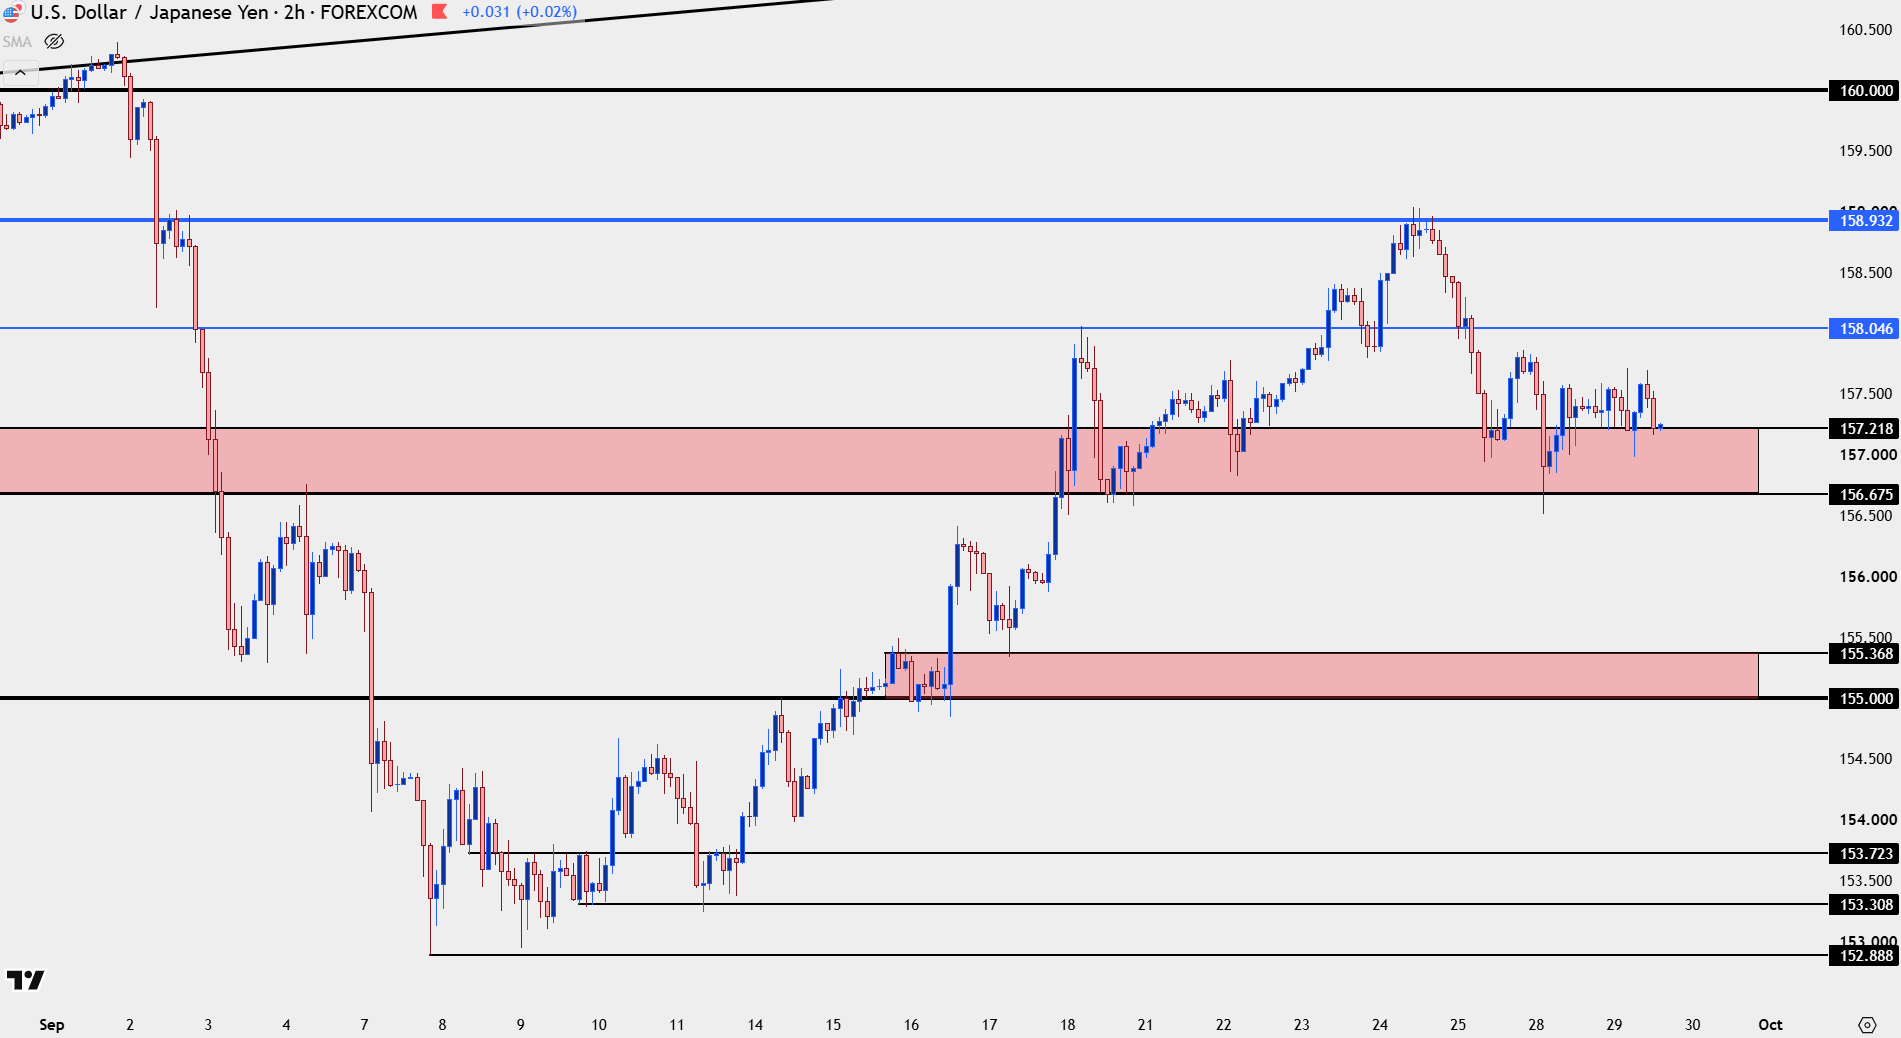
Chart prepared by James Stanley; data derived from Tradingview
--- written by James Stanley, Senior Market Analyst, Global Macro
Related tags:


Open an account in minutes
Experience award-winning platforms with fast and secure execution, and enjoy tight spreads from 0.5 pts on FX and 0.3 pts on indices.
Economic calendar
Web Trader platform
Our sophisticated web-based platform is packed with features.
Related articles

EUR/USD Clings to Support as Lagarde Announces Early Departure
EUR/USD has been mired in a steep sell-off as worries have built around French yields, but continued support around the 1.1100 level give hope for a bounce that could possibly turn into something more.

US Dollar Price Action Setups: EUR/USD, GBP/USD, USD/JPY
The US Dollar was up this week through a slew of Central Banks but next week sees the focus shift to mid-term elections and the week after brings inflation.

Nasdaq 100, S&P 500 Smashed as AI Bubble Fears Run Risk Aversion
It’s been a rocky few weeks for stocks starting with a bearish engulf in NVDA a few weeks ago and then the same formation in the S&P 500 two weeks ago. Sellers have since chewed through supports and fear is starting to spread, but is this the beginning of the end for the AI rally?
This report is intended for general circulation only. It should not be construed as a recommendation, or an offer (or solicitation of an offer) to buy or sell any financial products. The information provided does not take into account your specific investment objectives, financial situation or particular needs. Before you act on any recommendation that may be contained in this report, independent advice ought to be sought from a financial adviser regarding the suitability of the investment product, taking into account your specific investment objectives, financial situation or particular needs.
StoneX Financial Pte. Ltd., may distribute reports produced by its respective foreign entities or affiliates within the StoneX group of companies or third parties pursuant to an arrangement under Regulation 32C of the Financial Advisers Regulations. Where the report is distributed to a person in Singapore who is not an accredited investor, expert investor or an institutional investor (as defined in the Securities Futures Act), StoneX Financial Pte. Ltd. accepts legal responsibility to such persons for the contents of the report only to the extent required by law. Singapore recipients should contact StoneX Financial Pte. Ltd. at 6826 9988 for matters arising from, or in connection with the report.
In the case of all other recipients of this report, to the extent permitted by applicable laws and regulations neither StoneX Financial Pte. Ltd. nor its associated companies will be responsible or liable for any loss or damage incurred arising out of, or in connection with, any use of the information contained in this report and all such liability is hereby expressly disclaimed. No representation or warranty is made, express or implied, that the content of this report is complete or accurate.
StoneX Financial Pte. Ltd. is not under any obligation to update this report.
Trading CFDs carries a high level of risk that may not be suitable for some investors. Consider your investment objectives, level of experience, financial resources, risk appetite and other relevant circumstances carefully. The possibility exists that you could lose some or all of your investments, including your initial deposits. If in doubt, please seek independent expert advice. Visit www.forex.com/en-sg/terms-and-policies for the complete Risk Disclosure Statement.