



Gold Dips Below Three-Month Uptrend, Bitcoin Pulls Back from Nine-Month High
Gold has dipped below its three-month uptrend, while Bitcoin has pulled back from a nine-month high as U.S. bond yields test levels last seen in 2004 and 2007. Risks build as Fed rate-hike expectations remain above 70%, while the Dollar Index holds near yearly highs.
Share this:

Gold has dipped below its three-month uptrend, while Bitcoin has pulled back from a nine-month high as U.S. bond yields test levels last seen in 2004 and 2007. Risks build as Fed rate-hike expectations remain above 70%, while the Dollar Index holds near yearly highs above 101.
This combination of stretched bond yields, elevated dollar strength, and growing geopolitical tensions across key energy-transportation routes could help identify potential longer term market reversals or breakouts, particularly as the U.S. midterm elections approach.
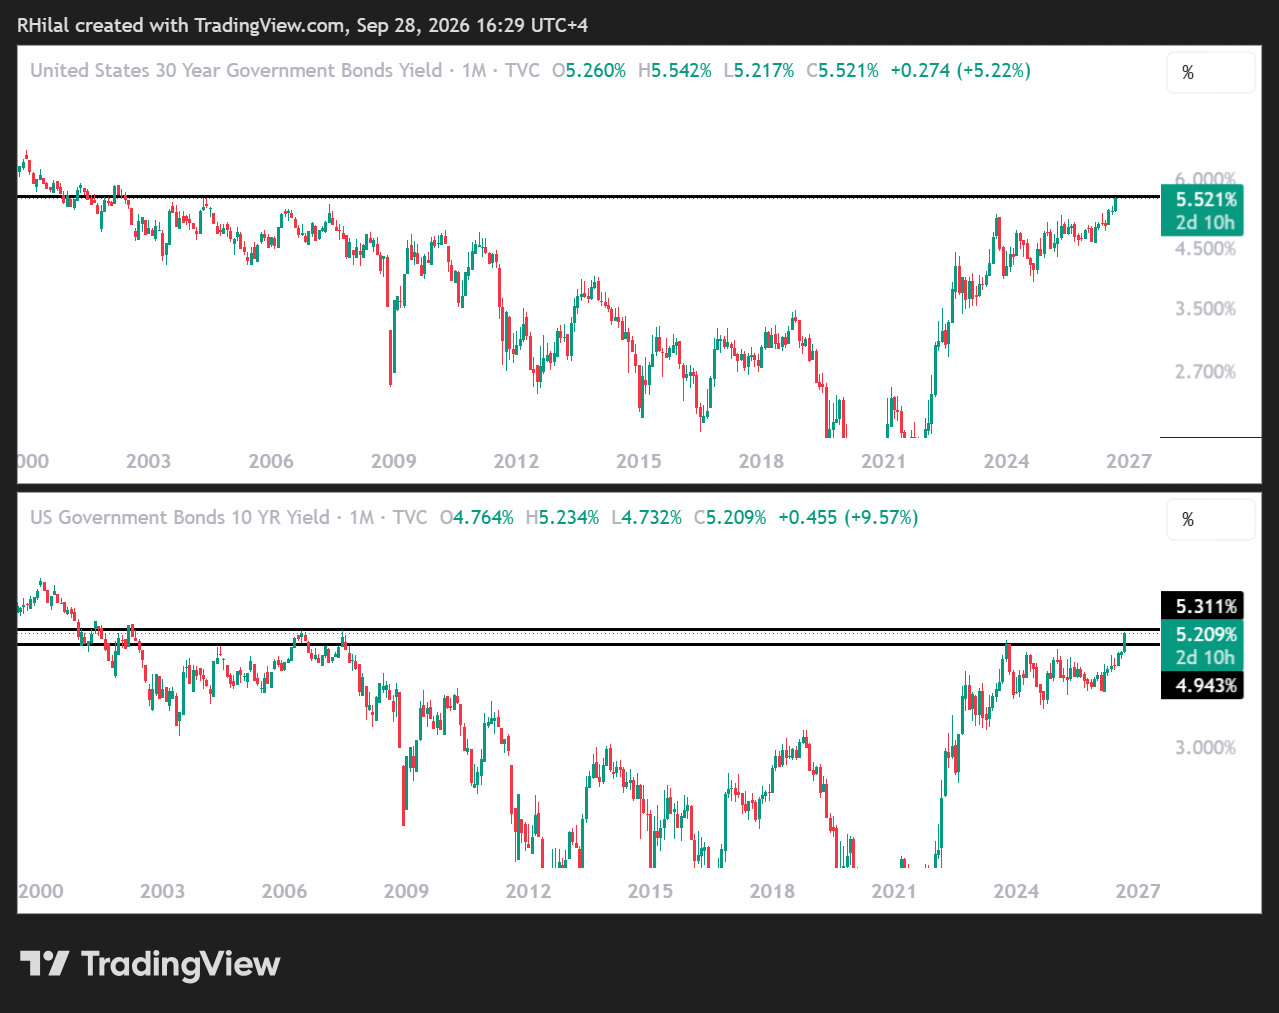
U.S. 10-Year and 30-Year Bond Yields — Monthly Time Frame — Log Scale
Source: TradingView
The key levels to watch on the Treasury-yield charts are 5.30% for the 10-year yield, a level last seen in 2007, and 5.60% for the 30-year yield, last seen in 2004.
These levels represent important resistance zones that could help determine whether yields continue higher or experience a significant reversal. Overbought weekly momentum risks date back to 2022-2023 on both charts. Their direction remains critical for market risk sentiment and precious-metals trends.
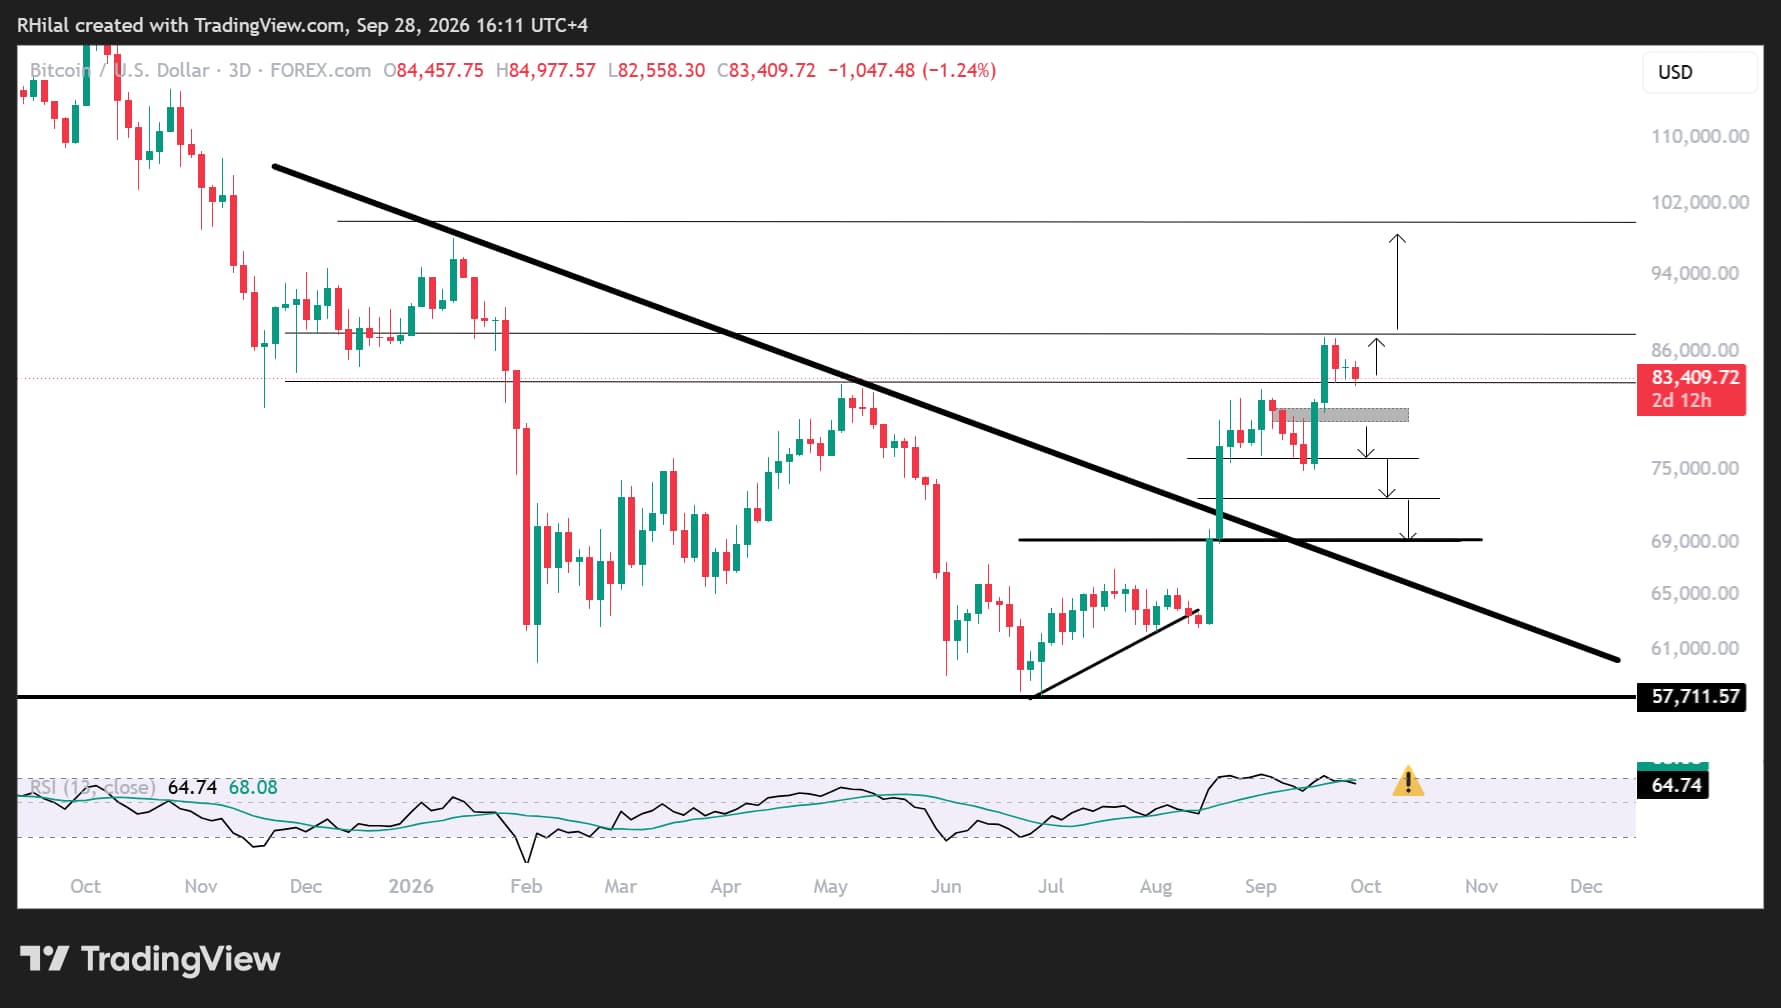
Bitcoin Price Outlook — 3-Day Time Frame — Log Scale
Source: TradingView
Following its rebound from weekly oversold conditions last seen in 2022 and the psychological 60,000 level, Bitcoin advanced toward highs last seen in January near 87,000.
At the same time, daily momentum is retesting overbought conditions, while rising bond yields and renewed rate-hike expectations are increasing market caution. This combination highlights short-term pullback risks.
The current pullback is being assessed through Fibonacci retracement levels of the June–September advance:
-
79,000 — 27.2% retracement
-
76,000 — 38.2% retracement
-
72,000 — 50% retracement
-
69,000 — 61.8% retracement and potential dip-buying zone
A breakdown below these levels would increase bearish risks toward the yearly lows and could align with a broader risk-off move across financial markets.
However, with yields already testing extreme resistance levels, reversal risks may be building. This could result in a short-term Bitcoin pullback rather than a lasting bearish trend. A close back above 87,000 would redirect attention toward 90,000, 95,000, and 100,000.
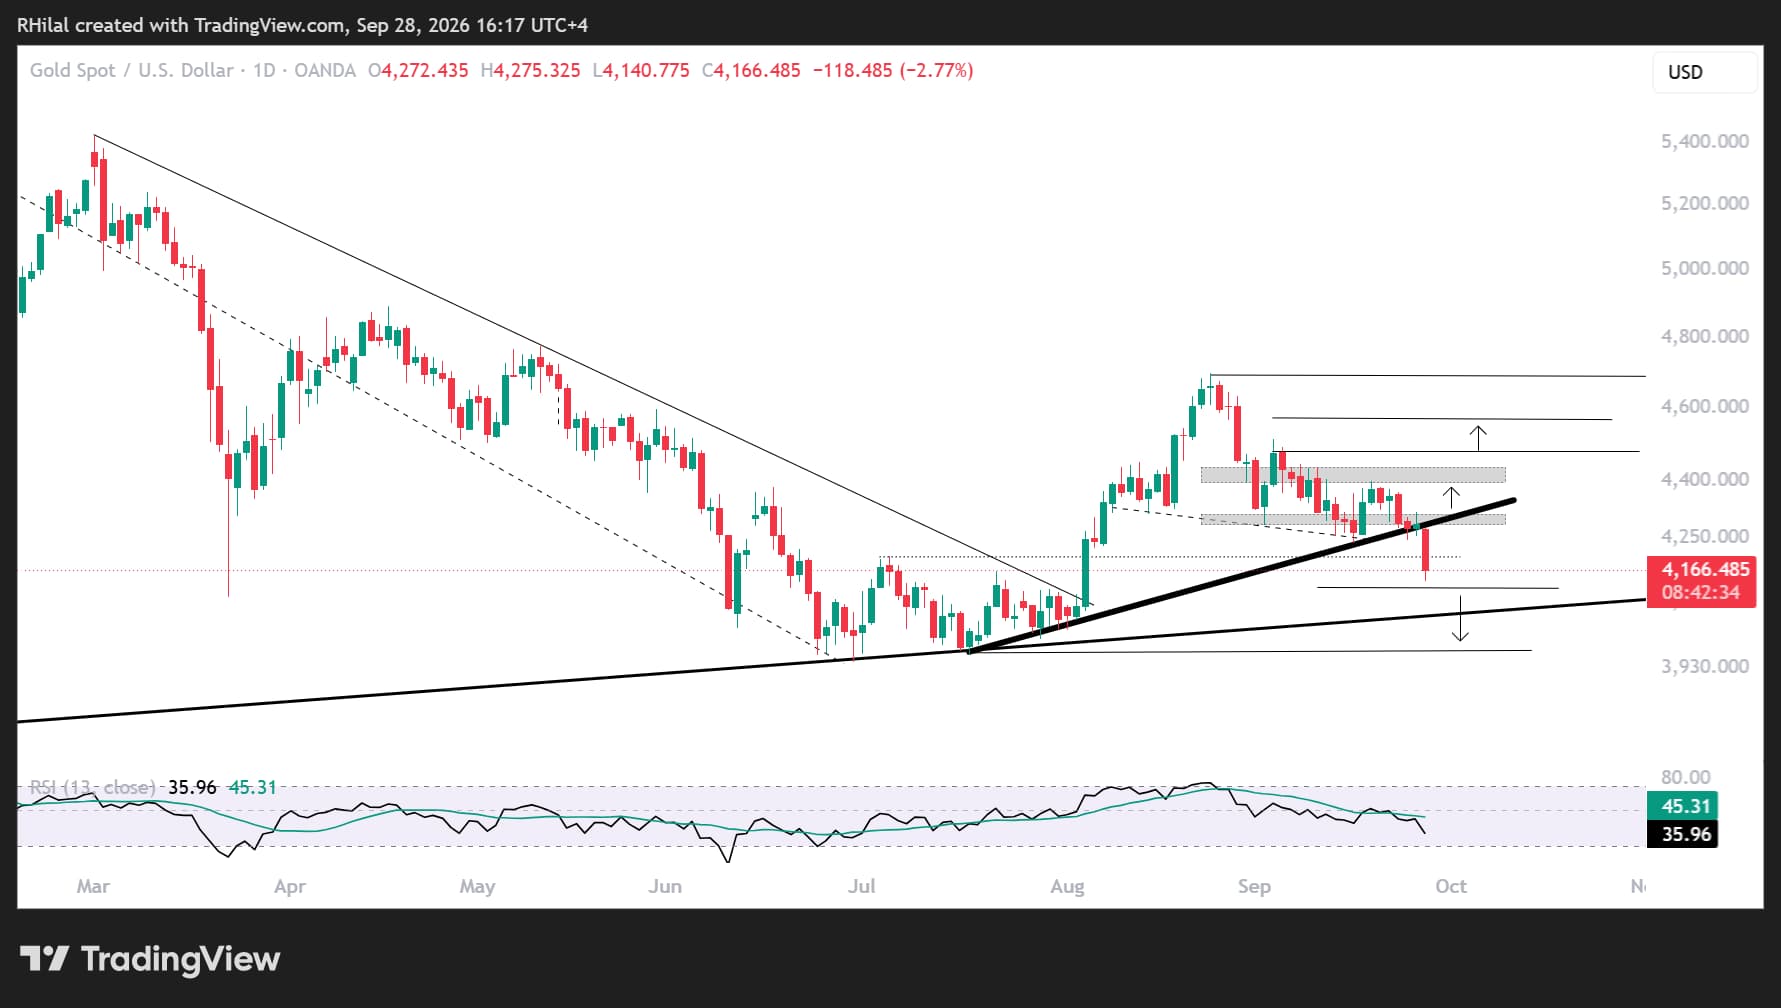
Gold Price Outlook — Daily Time Frame — Log Scale
Source: TradingView
On the daily time frame, gold is facing pressure from the sharp rise in Treasury yields after breaking below its three-month uptrend and the 4,240 support level.
The July–September advance is currently testing key support near 4,120, which also corresponds to the 78.6% Fibonacci retracement. This zone could provide another potential reversal opportunity.
A break below 4,120 would expose the psychological 4,000 level and the yearly lows, creating the possibility of another major dip-buying opportunity or a potential 500-point drawdown.
On the upside, reclaiming 4,240 and 4,300 would reinforce the bullish outlook and realign price action with the three-month uptrend. Further resistance levels stand near 4,400, 4,570, and 4,700, defined using the Fib extension tool across the July-September wave.
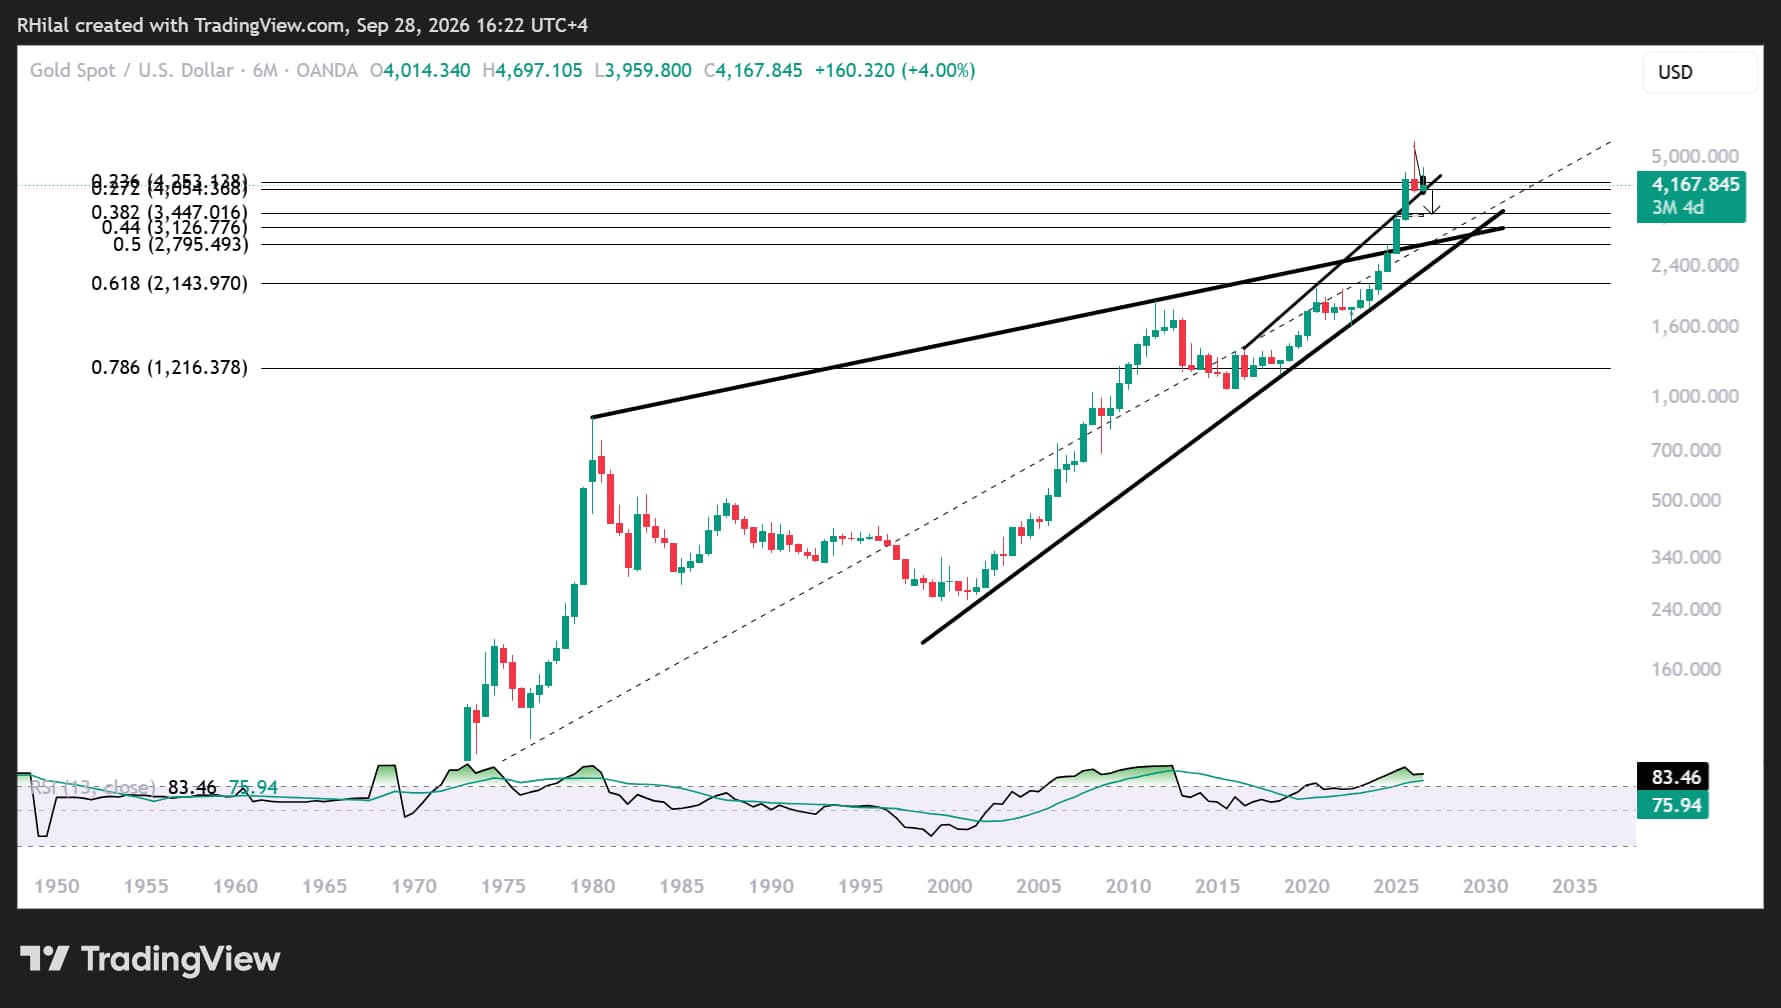
Gold Price Outlook — 6-Month Time Frame — Log Scale
Source: TradingView
From a 6-month perspective, the strength of the yearly low near 3,960 highlights a key confluence zone. This area combines resistance from the 2016–2026 structure, now acting as support, with the 27.2% retracement of the all-time advance between 1920 and 2026.
A confirmed breakdown below 3,960 would likely amplify the bearish wave toward the 38.2% retracement near 3,400. This level also aligns with the five-month resistance zone established in 2025 and could become another major dip-buying area.
For now, the primary risk remains short-term volatility and pullback pressure. Crude oil prices remain constrained below their seven-month barriers, while Treasury yields are testing multidecade resistance levels. As geopolitical negotiations continue and the U.S. midterm elections approach, the interaction between yields, the dollar, gold, and Bitcoin will remain critical for identifying the next broader market reversal.
Written by Razan Hilal, CMT
Follow on X: @Rh_waves



Open an account in minutes
Experience award-winning platforms with fast and secure execution, and enjoy tight spreads from 0.5 pts on FX and 0.3 pts on indices.
Economic calendar
Web Trader platform
Our sophisticated web-based platform is packed with features.
Related articles
AUD/USD, NZD/USD Outlook: Corrective Recoveries Face Growing Headwinds
A weaker US dollar, falling Treasury yields and renewed demand for cyclical assets have supported the Aussie and Kiwi. But with some of those moves reversing on Monday, both currencies face an early test of whether their recent strength can continue.

US Dollar, GBP/USD, USD/CAD, USD/CHF, Gold Weekly Technical Outlook 10 19 2026
Sr. Technical Strategist Michael Boutros highlights the levels that matter on the USD Majors, commodities, and equity indices charts this week.


Gold Sell-Off Stalls but Can Bulls Force a Turn?
Gold has dropped by as much as 13% from the August highs, and almost 30% from the January highs. More recently, however, bulls have been putting up a fight at the $4100 level that and that’s the item of importance for this week.

This report is intended for general circulation only. It should not be construed as a recommendation, or an offer (or solicitation of an offer) to buy or sell any financial products. The information provided does not take into account your specific investment objectives, financial situation or particular needs. Before you act on any recommendation that may be contained in this report, independent advice ought to be sought from a financial adviser regarding the suitability of the investment product, taking into account your specific investment objectives, financial situation or particular needs.
StoneX Financial Pte. Ltd., may distribute reports produced by its respective foreign entities or affiliates within the StoneX group of companies or third parties pursuant to an arrangement under Regulation 32C of the Financial Advisers Regulations. Where the report is distributed to a person in Singapore who is not an accredited investor, expert investor or an institutional investor (as defined in the Securities Futures Act), StoneX Financial Pte. Ltd. accepts legal responsibility to such persons for the contents of the report only to the extent required by law. Singapore recipients should contact StoneX Financial Pte. Ltd. at 6826 9988 for matters arising from, or in connection with the report.
In the case of all other recipients of this report, to the extent permitted by applicable laws and regulations neither StoneX Financial Pte. Ltd. nor its associated companies will be responsible or liable for any loss or damage incurred arising out of, or in connection with, any use of the information contained in this report and all such liability is hereby expressly disclaimed. No representation or warranty is made, express or implied, that the content of this report is complete or accurate.
StoneX Financial Pte. Ltd. is not under any obligation to update this report.
Trading CFDs carries a high level of risk that may not be suitable for some investors. Consider your investment objectives, level of experience, financial resources, risk appetite and other relevant circumstances carefully. The possibility exists that you could lose some or all of your investments, including your initial deposits. If in doubt, please seek independent expert advice. Visit www.forex.com/en-sg/terms-and-policies for the complete Risk Disclosure Statement.