





Gold Not Taking Any Chances
Gold has a head start on stocks and price has a lot of room to move to the upside
Share this:

Gold has moved above $1600 for the first time since the spike up to 1611 on January 8th as trepidation may be beginning to enter equity markets, which are already at lofty levels. Many major equity indices are near all-time highs, so a pullback of a few percent isn’t out of the question. Last night (in US), AAPL was the first to warn revenues may miss target for Q1. And recently today, Apple said iphone supply woes would continue into April or longer, according to the Nikkei. In addition, Walmart announced earnings this morning while also warning that they see full year EPS between $5.00-$5.15 vs previous estimates of $5.22. Surely AAPL and WMT can’t be the only ones who have production issues because of the virus. But equity markets will come up with any excuse to buy stocks, so it’s no surprise the Dow is only down 175, as traders assume AAPL will use a lower stock price to buy back stock. Gold isn’t believing it.
Why are they warning? The economy is “great” we constantly hear. It’s because of the slowdown in China due to the coronavirus. Chinese authorities had said its business as usual. However, many are saying things only seem to be “halfway” back to normal. And each day now, we hear of more and more horror stories circulating of more coronavirus cruise ships, increased cases and fatalities, and how the numbers are “worse” than reported. Can things get worse? Will more companies issue warnings? Gold seems to think so!
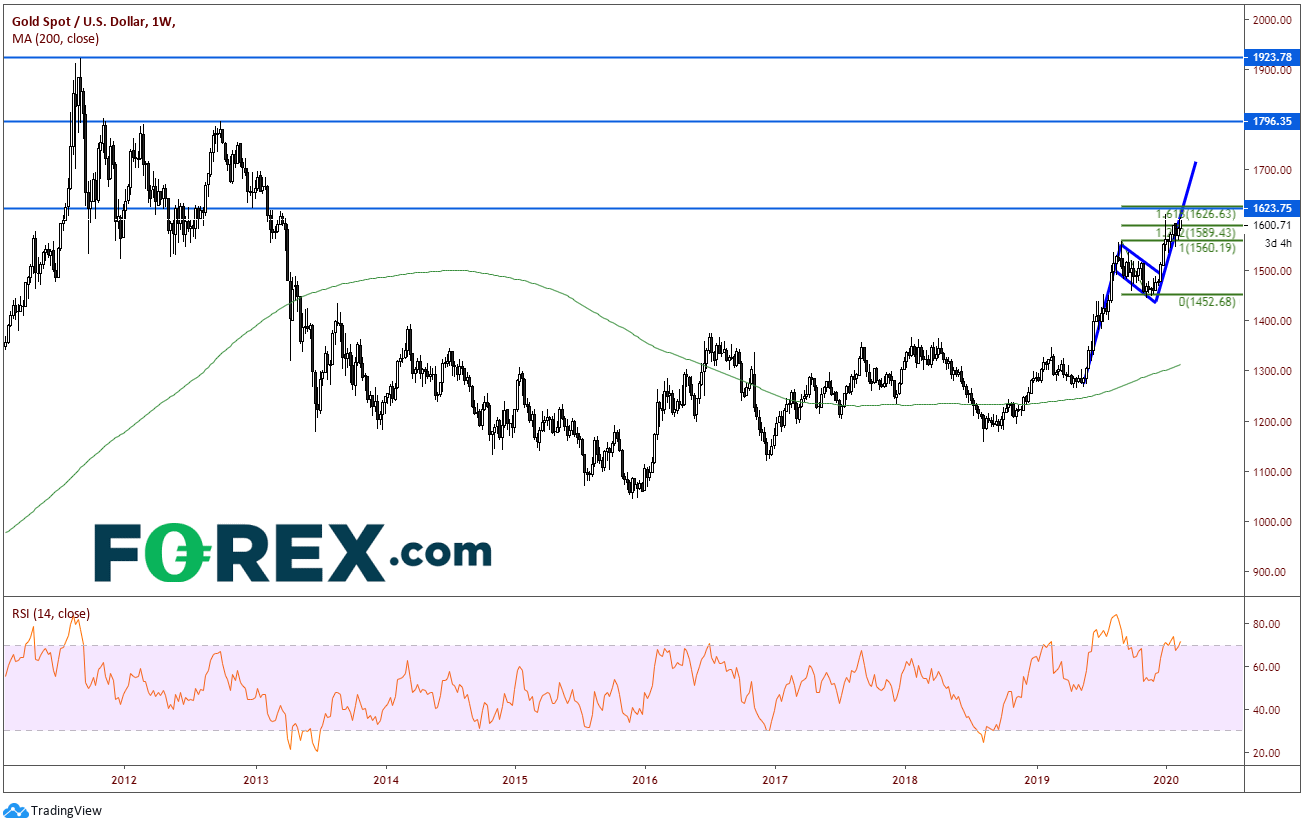
On a weekly timeframe, Gold is putting in a beautiful flag formation. Although the RSI is diverging from price, it is just moving into overbought territory, warning of a possible pullback while the RSI unwinds while price is on its way to target of the flag, which is near 1720.
Source: Tradingview, City Index
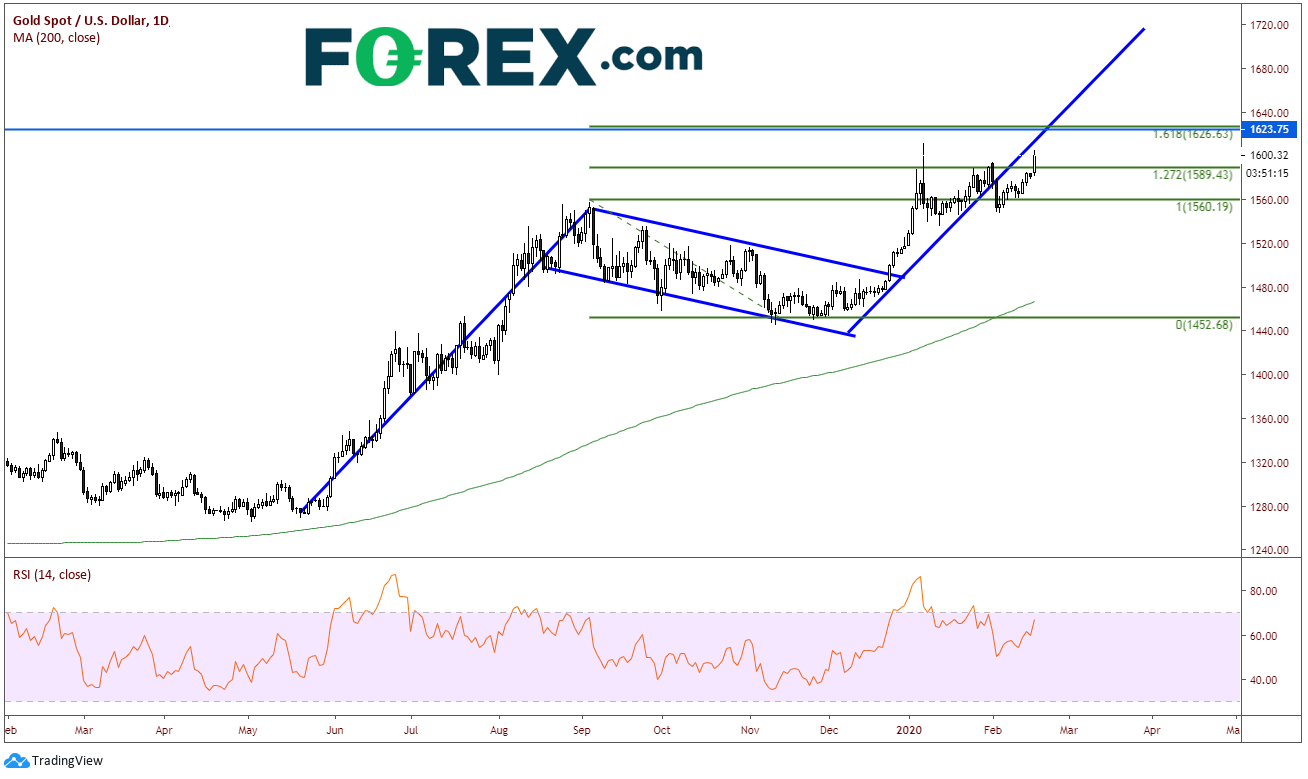
On a daily timeframe, price wants nothing to do with the RSI, as price is currently not diverging with RSI and Gold just crossed above the 127.2% Fibonacci extension from the highs of September 3rd, 2019 to the lows on November 12th, 2019, at 1588. The next resistance level is the previous spike high at 1611.34, then the 161.8% Fibonacci extension of the previously mentioned timeframe at 1625.72.
Source: Tradingview, City Index
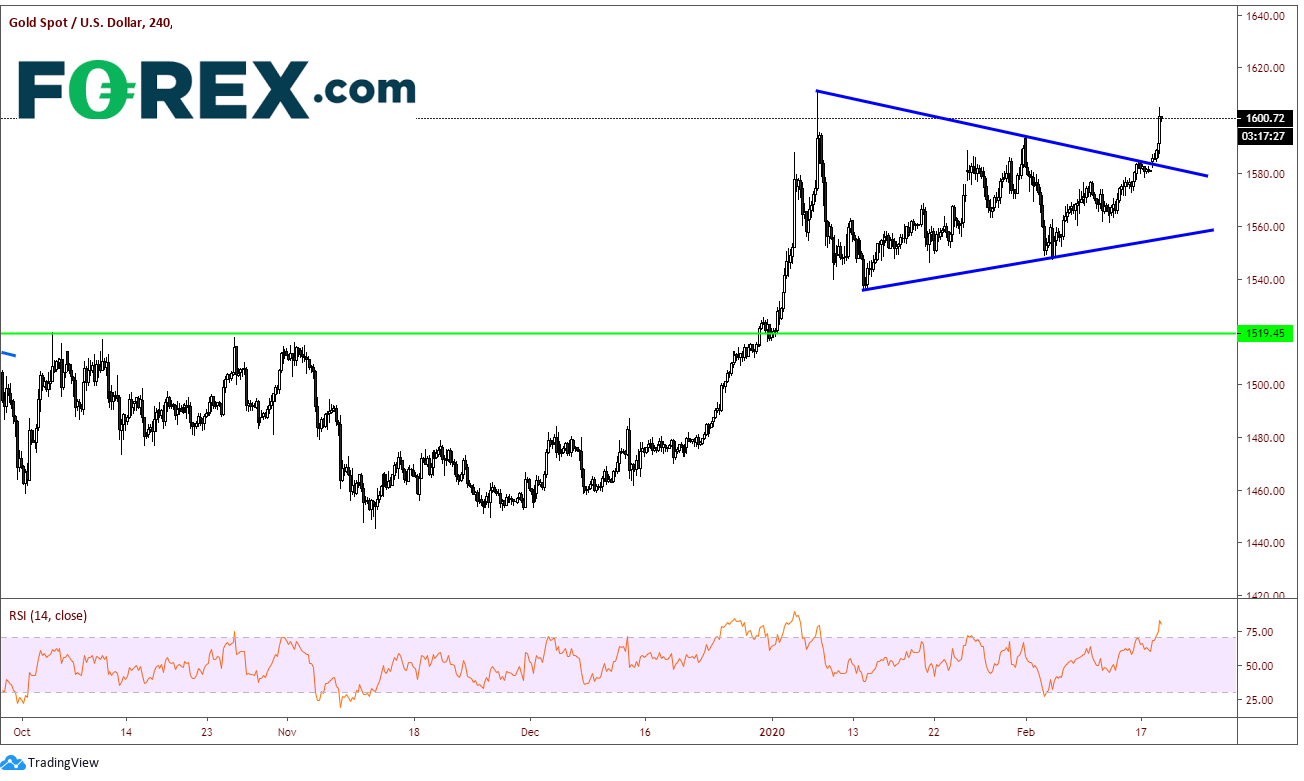
On a 240-minute timeframe, Gold has been in a symmetrical triangle since putting in the recent high on January 8th and broke out today. Buyers will be looking for dips to 1585 to buy at the downward sloping trendline from the top of the triangle. This will also give the RSI an opportunity to unwind on the shorter-term timeframe. Below that is the bottom trendline of the triangle, which is near 1555/1560. There is also horizontal support at this level on the daily timeframe. 1520 also provide horizonal support if the form of previous highs back in October.
Source: Tradingview, City Index
When and if more and more companies begin to warn markets of missing revenues and EPS, stocks may start to take notice. And if markets begin to believe the data from China regarding the coronavirus is inaccurate, equities may take note. Gold has a head start on stocks and price has a lot of room to move to the upside if equities do decide to come off!
Gold has moved above $1600 for the first time since the spike up to 1611 on January 8th as trepidation may be beginning to enter equity markets, which are already at lofty levels. Many major equity indices are near all-time highs, so a pullback of a few percent isn’t out of the question. Last night (in US), AAPL was the first to warn revenues may miss target for Q1. And recently today, Apple said iphone supply woes would continue into April or longer, according to the Nikkei. In addition, Walmart announced earnings this morning while also warning that they see full year EPS between $5.00-$5.15 vs previous estimates of $5.22. Surely AAPL and WMT can’t be the only ones who have production issues because of the virus. But equity markets will come up with any excuse to buy stocks, so it’s no surprise the Dow is only down 175, as traders assume AAPL will use a lower stock price to buy back stock. Gold isn’t believing it.
Why are they warning? The economy is “great” we constantly hear. It’s because of the slowdown in China due to the coronavirus. Chinese authorities had said its business as usual. However, many are saying things only seem to be “halfway” back to normal. And each day now, we hear of more and more horror stories circulating of more coronavirus cruise ships, increased cases and fatalities, and how the numbers are “worse” than reported. Can things get worse? Will more companies issue warnings? Gold seems to think so!
On a weekly timeframe, Gold is putting in a beautiful flag formation. Although the RSI is diverging from price, it is just moving into overbought territory, warning of a possible pullback while the RSI unwinds while price is on its way to target of the flag, which is near 1720.
Source: Tradingview, FOREX.com
On a daily timeframe, price wants nothing to do with the RSI, as price is currently not diverging with RSI and Gold just crossed above the 127.2% Fibonacci extension from the highs of September 3rd, 2019 to the lows on November 12th, 2019, at 1588. The next resistance level is the previous spike high at 1611.34, then the 161.8% Fibonacci extension of the previously mentioned timeframe at 1625.72.
Source: Tradingview, FOREX.com
On a 240-minute timeframe, Gold has been in a symmetrical triangle since putting in the recent high on January 8th and broke out today. Buyers will be looking for dips to 1585 to buy at the downward sloping trendline from the top of the triangle. This will also give the RSI an opportunity to unwind on the shorter-term timeframe. Below that is the bottom trendline of the triangle, which is near 1555/1560. There is also horizontal support at this level on the daily timeframe. 1520 also provide horizonal support if the form of previous highs back in October.
Source: Tradingview, FOREX.com
When and if more and more companies begin to warn markets of missing revenues and EPS, stocks may start to take notice. And if markets begin to believe the data from China regarding the coronavirus is inaccurate, equities may take note. Gold has a head start on stocks and price has a lot of room to move to the upside if equities do decide to come off!


Open an account in minutes
Experience award-winning platforms with fast and secure execution, and enjoy tight spreads from 0.5 pts on FX and 0.3 pts on indices.
Economic calendar
Web Trader platform
Our sophisticated web-based platform is packed with features.
Related articles
Gold forecast: Rising yields become too hot for gold, but the outlook is far from bearish
Gold and silver prices took a plunge today, with the former down 3% and the latter falling some 5% by mid European session, before bouncing off their lows. The losses come after the metals remained largely supported until last week, despite the big dollar rally and surging bond yields as we have seen in recent weeks. But it simply got too much, and the metals succumbed to pressure today.

USD into a Massive Week as Yields Fly and Gold Breaks
It’s a huge week with PCE and NFP, but it’s what’s happening off of the calendar that demands attention with US yields flying to fresh multi-decade highs.


USDJPY Forecast Intervention Fears Clash with Dollar Strength
Recent trading sessions have produced mixed results for the Japanese yen. By the end of last week, USD/JPY had fallen by more than 1.00%, reflecting a modest recovery in the yen. However, the start of this week has seen the pair move slightly back in favor of the U.S. dollar, posting gains of around 0.04%.

This report is intended for general circulation only. It should not be construed as a recommendation, or an offer (or solicitation of an offer) to buy or sell any financial products. The information provided does not take into account your specific investment objectives, financial situation or particular needs. Before you act on any recommendation that may be contained in this report, independent advice ought to be sought from a financial adviser regarding the suitability of the investment product, taking into account your specific investment objectives, financial situation or particular needs.
StoneX Financial Pte. Ltd., may distribute reports produced by its respective foreign entities or affiliates within the StoneX group of companies or third parties pursuant to an arrangement under Regulation 32C of the Financial Advisers Regulations. Where the report is distributed to a person in Singapore who is not an accredited investor, expert investor or an institutional investor (as defined in the Securities Futures Act), StoneX Financial Pte. Ltd. accepts legal responsibility to such persons for the contents of the report only to the extent required by law. Singapore recipients should contact StoneX Financial Pte. Ltd. at 6826 9988 for matters arising from, or in connection with the report.
In the case of all other recipients of this report, to the extent permitted by applicable laws and regulations neither StoneX Financial Pte. Ltd. nor its associated companies will be responsible or liable for any loss or damage incurred arising out of, or in connection with, any use of the information contained in this report and all such liability is hereby expressly disclaimed. No representation or warranty is made, express or implied, that the content of this report is complete or accurate.
StoneX Financial Pte. Ltd. is not under any obligation to update this report.
Trading CFDs carries a high level of risk that may not be suitable for some investors. Consider your investment objectives, level of experience, financial resources, risk appetite and other relevant circumstances carefully. The possibility exists that you could lose some or all of your investments, including your initial deposits. If in doubt, please seek independent expert advice. Visit www.forex.com/en-sg/terms-and-policies for the complete Risk Disclosure Statement.